

You will also find often stocks that pay only a small amount of their annual income back to shareholders.
Good companies with no growth costs will consider paying the rest of the income via share buybacks.
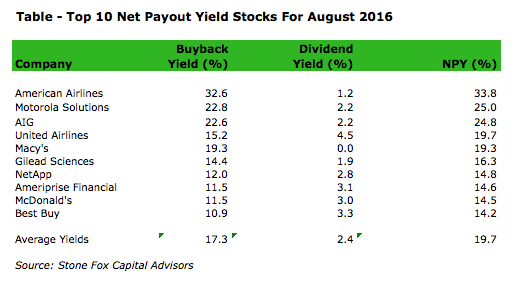
Within the financial scene we discuss the theme shareholder yield, a ratio that quantifies the dividend yield and buyback yield as a whole.
It's quite simple, the bigger the shareholder yield, the more money being paid back to the owners of the company.
Attached you will find the 10 stocks with the highest shareholder yield of the current month.
These are the results...
Macy's -- Yield: 4.44% - Shareholder Yield: 19.3%
Macy's (NYSE:M) employs 157,900 people, generates revenue of $27,079.00 million and has a net income of $1,070.00 million. The current market capitalization stands at $10.19Billion.Macy's’s earnings before interest, taxes, depreciation and amortization (EBITDA) amounts to $3,388.00 million. The EBITDA margin is 12.51% (the operating margin is 7.53% and the net profit margin 3.95%).
Financials: The total debt represents 37.12% of Macy's assets and the total debt in relation to the equity amounts to 179.69%. Due to the financial situation, a return on equity of 22.27% was realized by Macy's.
Twelve trailing months earnings per share reached a value of $3.09. Last fiscal year, Macy's paid $1.39 in the form of dividends to shareholders.
Market Valuation: Here are the price ratios of the company: The P/E ratio is 11.00, the P/S ratio is 0.39 and the P/B ratio is finally 2.48. The dividend yield amounts to 4.44%.
Stock Charts:
") |
| Long-Term Stock Price Chart of Macy's (M) |
") |
| Long-Term Dividend Payment History of Macy's (M) |
") |
| Long-Term Dividend Yield History of Macy's (M) |
Best Buy -- Yield: 3.32% - Shareholder Yield: 14.2%
Best Buy (NYSE:BBY) employs 125,000 people, generates revenue of $39,528.00 million and has a net income of $807.00 million. The current market capitalization stands at $10.75Billion.Best Buy’s earnings before interest, taxes, depreciation and amortization (EBITDA) amounts to $2,227.00 million. The EBITDA margin is 5.63% (the operating margin is 3.48% and the net profit margin 2.04%).
Financials: The total debt represents 12.83% of Best Buy assets and the total debt in relation to the equity amounts to 39.61%. Due to the financial situation, a return on equity of 17.22% was realized by Best Buy.
Twelve trailing months earnings per share reached a value of $2.92. Last fiscal year, Best Buy paid $0.92 in the form of dividends to shareholders.
Market Valuation: Here are the price ratios of the company: The P/E ratio is 11.55, the P/S ratio is 0.28 and the P/B ratio is finally 2.49. The dividend yield amounts to 3.32%.
Stock Charts:
") |
| Long-Term Stock Price Chart of Best Buy (BBY) |
") |
| Long-Term Dividend Payment History of Best Buy (BBY) |
") |
| Long-Term Dividend Yield History of Best Buy (BBY) |
Ameriprise Financial -- Yield: 3.13% - Shareholder Yield: 14.6%
Ameriprise Financial (NYSE:AMP) employs 13,000 people, generates revenue of $12,200.00 million and has a net income of $1,687.00 million. The current market capitalization stands at $15.36Billion.Ameriprise Financial’s earnings before interest, taxes, depreciation and amortization (EBITDA) amounts to $2,928.00 million. The EBITDA margin is 24.00% (the operating margin is 20.73% and the net profit margin 13.83%).
Financials: The total debt represents 13.11% of Ameriprise Financial assets and the total debt in relation to the equity amounts to 264.06%. Due to the financial situation, a return on equity of 20.36% was realized by Ameriprise Financial.
Twelve trailing months earnings per share reached a value of $8.23. Last fiscal year, Ameriprise Financial paid $2.59 in the form of dividends to shareholders.
Market Valuation: Here are the price ratios of the company: The P/E ratio is 11.64, the P/S ratio is 1.27 and the P/B ratio is finally 2.27. The dividend yield amounts to 3.13%.
Stock Charts:
") |
| Long-Term Stock Price Chart of Ameriprise Financial (AMP) |
") |
| Long-Term Dividend Payment History of Ameriprise Financial (AMP) |
") |
| Long-Term Dividend Yield History of Ameriprise Financial (AMP) |
McDonald's Corporation -- Yield: 3.00% - Shareholder Yield: 14.5%
McDonald's Corporation (NYSE:MCD) employs 420,000 people, generates revenue of $25,413.00 million and has a net income of $4,529.30 million. The current market capitalization stands at $101.40Billion.McDonald's Corporation’s earnings before interest, taxes, depreciation and amortization (EBITDA) amounts to $8,871.70 million. The EBITDA margin is 34.91% (the operating margin is 28.12% and the net profit margin 17.82%).
Financials: The total debt represents 63.58% of McDonald's Corporation assets and the total debt in relation to the equity amounts to 340.33%. Due to the financial situation, a return on equity of 45.43% was realized by McDonald's Corporation.
Twelve trailing months earnings per share reached a value of $5.25. Last fiscal year, McDonald's Corporation paid $3.44 in the form of dividends to shareholders.
Market Valuation: Here are the price ratios of the company: The P/E ratio is 22.62, the P/S ratio is 3.99 and the P/B ratio is finally 15.20. The dividend yield amounts to 3.00%.
Stock Charts:
") |
| Long-Term Stock Price Chart of McDonald's Corporation (MCD) |
") |
| Long-Term Dividend Payment History of McDonald's Corporation (MCD) |
") |
| Long-Term Dividend Yield History of McDonald's Corporation (MCD) |
NetApp -- Yield: 2.75% - Shareholder Yield: 14.8%
NetApp (NASDAQ:NTAP) employs 12,030 people, generates revenue of $5,546.00 million and has a net income of $229.00 million. The current market capitalization stands at $7.75Billion.NetApp’s earnings before interest, taxes, depreciation and amortization (EBITDA) amounts to $692.00 million. The EBITDA margin is 12.48% (the operating margin is 6.27% and the net profit margin 4.13%).
Financials: The total debt represents 23.30% of NetApp assets and the total debt in relation to the equity amounts to 81.19%. Due to the financial situation, a return on equity of 7.28% was realized by NetApp.
Twelve trailing months earnings per share reached a value of $0.78. Last fiscal year, NetApp paid $0.72 in the form of dividends to shareholders.
Market Valuation: Here are the price ratios of the company: The P/E ratio is 35.61, the P/S ratio is 1.39 and the P/B ratio is finally 2.69. The dividend yield amounts to 2.75%.
Stock Charts:
") |
| Long-Term Stock Price Chart of NetApp (NTAP) |
") |
| Long-Term Dividend Payment History of NetApp (NTAP) |
") |
| Long-Term Dividend Yield History of NetApp (NTAP) |
Gilead Sciences -- Yield: 2.38% - Shareholder Yield: 16.3%
Gilead Sciences (NASDAQ:GILD) employs 8,000 people, generates revenue of $32,639.00 million and has a net income of $18,106.00 million. The current market capitalization stands at $103.59Billion.Gilead Sciences’s earnings before interest, taxes, depreciation and amortization (EBITDA) amounts to $23,287.00 million. The EBITDA margin is 71.35% (the operating margin is 68.00% and the net profit margin 55.47%).
Financials: The total debt represents 42.65% of Gilead Sciences assets and the total debt in relation to the equity amounts to 119.01%. Due to the financial situation, a return on equity of 106.64% was realized by Gilead Sciences.
Twelve trailing months earnings per share reached a value of $11.35. Last fiscal year, Gilead Sciences paid $1.29 in the form of dividends to shareholders.
Market Valuation: Here are the price ratios of the company: The P/E ratio is 6.95, the P/S ratio is 3.19 and the P/B ratio is finally 6.05. The dividend yield amounts to 2.38%.
Stock Charts:
") |
| Long-Term Stock Price Chart of Gilead Sciences (GILD) |
") |
| Long-Term Dividend Payment History of Gilead Sciences (GILD) |
") |
| Long-Term Dividend Yield History of Gilead Sciences (GILD) |
Motorola Solution -- Yield: 2.21% - Shareholder Yield: 25%
Motorola Solution (NYSE:MSI) employs 14,000 people, generates revenue of $5,695.00 million and has a net income of $643.00 million. The current market capitalization stands at $12.44Billion.Motorola Solution’s earnings before interest, taxes, depreciation and amortization (EBITDA) amounts to $1,220.00 million. The EBITDA margin is 21.42% (the operating margin is 17.35% and the net profit margin 11.29%).
Financials: The total debt represents 52.11% of Motorola Solution assets and the total debt in relation to the equity amounts to not calculable%. Due to the financial situation, a return on equity of 48.69% was realized by Motorola Solution.
Twelve trailing months earnings per share reached a value of $2.88. Last fiscal year, Motorola Solution paid $1.43 in the form of dividends to shareholders.
Market Valuation: Here are the price ratios of the company: The P/E ratio is 25.82, the P/S ratio is 2.17 and the P/B ratio is finally not calculable. The dividend yield amounts to 2.21%.
Stock Charts:
") |
| Long-Term Stock Price Chart of Motorola Solution (MSI) |
") |
| Long-Term Dividend Payment History of Motorola Solution (MSI) |
") |
| Long-Term Dividend Yield History of Motorola Solution (MSI) |
American International Group -- Yield: 2.17% - Shareholder Yield: 24.8%
American International Group (NYSE:AIG) employs 66,400 people, generates revenue of $58,918.00 million and has a net income of $2,222.00 million. The current market capitalization stands at $63.04Billion.American International Group’s earnings before interest, taxes, depreciation and amortization (EBITDA) amounts to $15,785.00 million. The EBITDA margin is 26.79% (the operating margin is 7.76% and the net profit margin 3.77%).
Financials: The total debt represents 5.89% of American International Group assets and the total debt in relation to the equity amounts to 32.62%. Due to the financial situation, a return on equity of 2.23% was realized by American International Group.
Twelve trailing months earnings per share reached a value of $-0.05. Last fiscal year, American International Group paid $0.81 in the form of dividends to shareholders.
Market Valuation: Here are the price ratios of the company: The P/E ratio is not calculable, the P/S ratio is 1.07 and the P/B ratio is finally 0.79. The dividend yield amounts to 2.17%.
Stock Charts:
") |
| Long-Term Stock Price Chart of American International Group (AIG) |
") |
| Long-Term Dividend Payment History of American International Group (AIG) |
") |
| Long-Term Dividend Yield History of American International Group (AIG) |
American Airlines -- Yield: 1.17% - Shareholder Yield: 33.8%
American Airlines (NASDAQ:AAL) employs 118,500 people, generates revenue of $40,990.00 million and has a net income of $7,610.00 million. The current market capitalization stands at $18.24Billion.American Airlines’s earnings before interest, taxes, depreciation and amortization (EBITDA) amounts to $9,458.00 million. The EBITDA margin is 23.07% (the operating margin is 15.14% and the net profit margin 18.57%).
Financials: The total debt represents 42.87% of American Airlines assets and the total debt in relation to the equity amounts to 368.31%. Due to the financial situation, a return on equity of 198.80% was realized by American Airlines.
Twelve trailing months earnings per share reached a value of $10.40. Last fiscal year, American Airlines paid $0.40 in the form of dividends to shareholders.
Market Valuation: Here are the price ratios of the company: The P/E ratio is 3.29, the P/S ratio is 0.44 and the P/B ratio is finally 3.79. The dividend yield amounts to 1.17%.
Stock Charts:
") |
| Long-Term Stock Price Chart of American Airlines (AAL) |
") |
| Long-Term Dividend Payment History of American Airlines (AAL) |
") |
| Long-Term Dividend Yield History of American Airlines (AAL) |
United Continental Holdings -- Shareholder Yield: 19.7%
United Continental Holdings (NYSE:UAL) employs 87,500 people, generates revenue of $37,864.00 million and has a net income of $7,340.00 million. The current market capitalization stands at $14.98Billion.United Continental Holdings’s earnings before interest, taxes, depreciation and amortization (EBITDA) amounts to $7,311.00 million. The EBITDA margin is 19.31% (the operating margin is 13.64% and the net profit margin 19.39%).
Financials: The total debt represents 28.78% of United Continental Holdings assets and the total debt in relation to the equity amounts to 131.15%. Due to the financial situation, a return on equity of 129.20% was realized by United Continental Holdings.
Twelve trailing months earnings per share reached a value of $17.70. Last fiscal year, United Continental Holdings paid $0.00 in the form of dividends to shareholders.
Market Valuation: Here are the price ratios of the company: The P/E ratio is 2.66, the P/S ratio is 0.40 and the P/B ratio is finally 1.92. The dividend yield amounts to no dividend%.
Stock Charts:
") |
| Long-Term Stock Price Chart of United Continental Holdings (UAL) |
") |
| Long-Term Dividend Payment History of United Continental Holdings (UAL) |
") |
| Long-Term Dividend Yield History of United Continental Holdings (UAL) |
 |
| Top 10 Net Payout Yields For August 2016 (Source: Seeking Alpha) |