

Johnson & Johnson (NYSE: JNJ) is trading near its all-time high of $276.47, up more than 50% over the past 12 months — one of the stronger runs among major healthcare stocks this year.
What's behind it:
The company posted a strong second quarter, with revenue of $25.3 billion (+5.6% operationally) and adjusted earnings per share of $2.90, beating estimates. Management raised full-year guidance and now expects to cross $100 billion in annual revenue for the first time. Growth is being led by the Innovative Medicine segment, with cancer and immunology drugs like DARZALEX, TREMFYA and CARVYKTI all performing well, alongside newer launches such as ICOTYDE.
Where the risks are:
The company's older immunology drug STELARA continues to lose sales to biosimilar competitors, acting as a persistent drag on growth. In its MedTech division, a China inventory issue and softer data on the Abiomed heart pump have slowed momentum, though management describes this as temporary.
The biggest overhang remains legal: J&J has proposed a $5.5 billion settlement covering roughly 76,000 talc-related ovarian cancer lawsuits, but the deal requires approval from 95% of eligible claimants to move forward — and a separate $10 million jury verdict in Louisiana this month is a reminder that not all cases are covered.
On valuation, the stock now trades at about 31 times trailing earnings, a premium to peers like Pfizer, Merck and AbbVie. Wall Street analysts remain broadly positive, with an average price target close to where the stock is already trading — suggesting much of the recent good news may already be priced in.
Johnson & Johnson also remains a "Dividend King," having raised its dividend for more than 60 consecutive years, though the current yield of under 2% is on the lower end of its own historical range given how far the share price has climbed.
Full breakdown of the business, competitors, latest earnings and dividend history in the article — link below. This is not investment advice.
👉 Read the full analysis: https://steady.page/en/dividends/posts/446df21a-4de7-42d5-9a91-5e6986c1f647
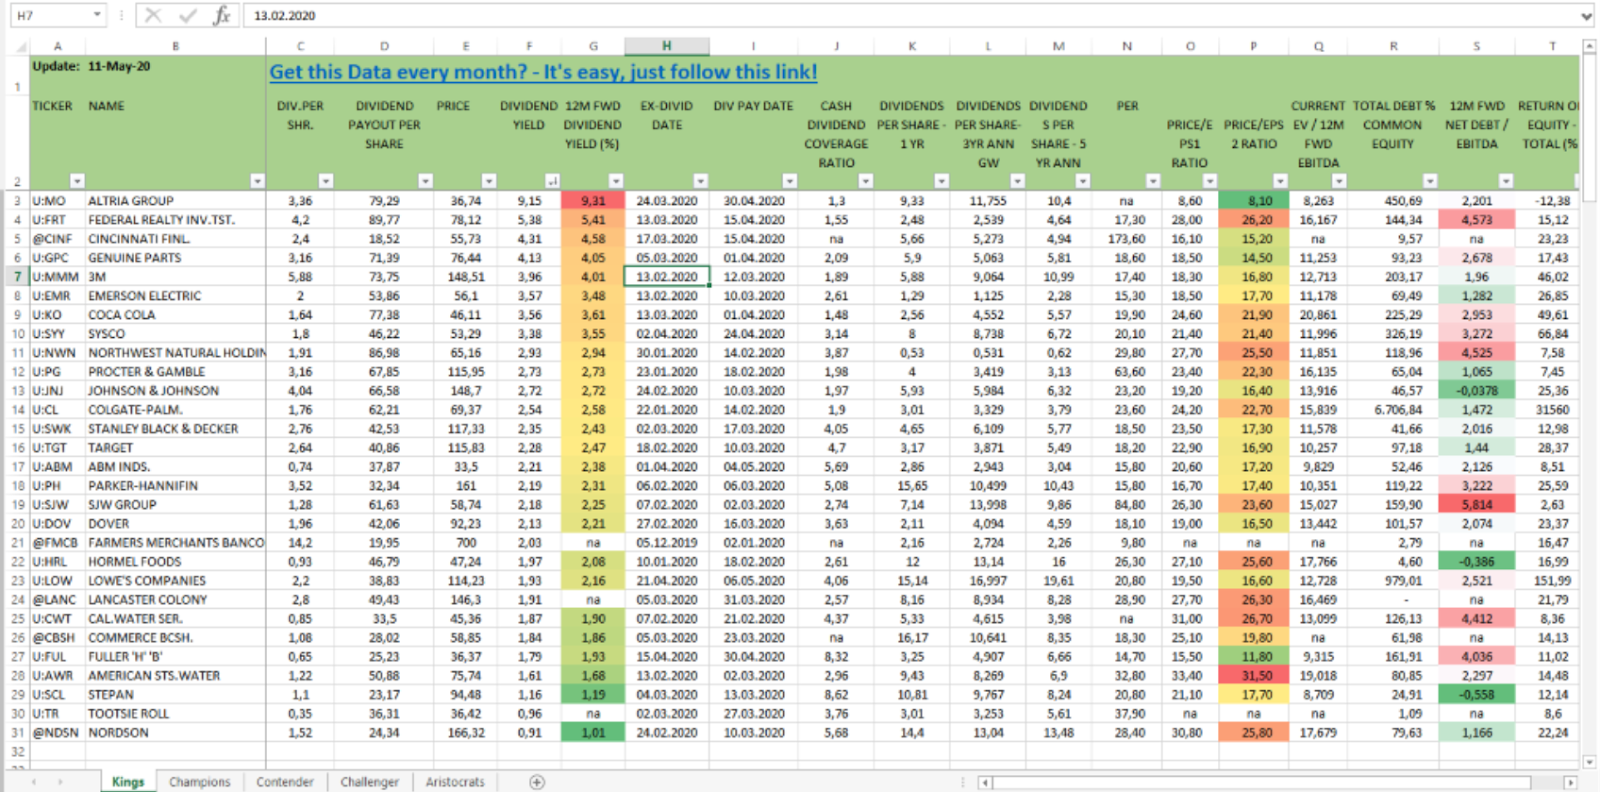
by the way...if you like this list and you want more tables like the above published, please help us now. Please read the following text to understand why we need your help. Thank you.You can use these lists to display, modify, calculate and sort important key figures such as the dividend yield, return on equity ratio, FCF-Yield or price-to-book-ratio. Over 40 ratios are available for sorting. The lists are updated once a month and will be free to use for all supporter on Steady.
INSERT_STEADY_CHECKOUT_HERE
With your support, the project can remain financially independent and can be further developed without annoying advertising or paywalls.
Thank you so much for your support! If you don't have the financial flexibility to help me, you can easily share this project or post with your social connections on Facebook, Twitter, Instagam, Pinterest or TikToc. It could be a great way to keep this site alive. Thank you so much.
