

Investors searching for dividend growth stocks to watch in September 2026 have plenty of interesting candidates to consider.
Our latest screen highlights 20 companies with dividend yields ranging from 1.42% to 7.92%, including high-yield names such as Blue Owl Capital, Kaspi.kz, Comcast, Gold Fields and TPG.
But dividend yield alone does not tell the whole story. Investors should also consider valuation, free cash flow, competitive advantages, growth opportunities and the risks that could threaten future dividend payments.
20 Dividend Growth Stocks on the Watchlist
| Rank | Ticker | Company | Dividend Yield | Forward P/E |
|---|---|---|---|---|
| 1 | OWL | Blue Owl Capital | 7.92% | 11.83 |
| 2 | KSPI | Kaspi.kz | 7.26% | 7.28 |
| 3 | CMCSA | Comcast | 4.92% | 7.47 |
| 4 | GFI | Gold Fields | 4.89% | 8.86 |
| 5 | TPG | TPG | 4.51% | 14.63 |
| 6 | HTHT | H World Group | 4.26% | 16.12 |
| 7 | AU | AngloGold Ashanti | 4.02% | 12.90 |
| 8 | HMY | Harmony Gold | 3.57% | 6.25 |
| 9 | ACN | Accenture | 3.48% | 12.71 |
| 10 | TGT | Target | 2.43% | 17.75 |
| 11 | TRI | Thomson Reuters | 2.36% | 21.43 |
| 12 | BR | Broadridge Financial Solutions | 2.32% | 16.04 |
| 13 | B | Barrick Mining | 2.30% | 11.69 |
| 14 | ERIE | Erie Indemnity | 2.18% | N/A |
| 15 | PSKY | Paramount Skydance | 2.13% | 12.66 |
| 16 | CTSH | Cognizant Technology Solutions | 2.12% | 9.85 |
| 17 | BDX | Becton Dickinson | 2.09% | 14.35 |
| 18 | SCCO | Southern Copper | 1.87% | 30.48 |
| 19 | FDS | FactSet Research Systems | 1.48% | 15.57 |
| 20 | EL | Estée Lauder | 1.42% | 26.41 |
5 Dividend Stocks That Stand Out
1. Blue Owl Capital (NYSE: OWL)
Blue Owl Capital has the highest dividend yield on the screen at 7.92%.
The alternative asset manager is positioned to benefit from the continued expansion of private credit and other alternative investments. Its recurring management-fee model can provide a strong foundation for shareholder distributions.
The key attraction is the combination of a high starting yield and potential dividend growth as assets under management and distributable earnings expand.
Moat: Scale, investment capabilities, institutional relationships and recurring fee revenue.
Opportunities: Growth in private markets, private credit and wealth-management distribution.
Problems: Earnings can be affected by fundraising conditions, asset valuations and performance-related revenue.
Risks: A prolonged market downturn could slow fundraising, reduce assets under management and pressure earnings.
Investor takeaway: OWL is one of the most interesting names for investors seeking high dividend yield plus potential dividend growth, although its business is more cyclical than a traditional defensive dividend stock.
2. Kaspi.kz (NASDAQ: KSPI)
Kaspi.kz combines a remarkable 7.26% dividend yield with a forward P/E of only 7.28.
The company operates a digital ecosystem covering payments, e-commerce and financial services. This combination can create powerful customer relationships and multiple opportunities to monetize user activity.
Kaspi also stands out for dividend-growth potential. The company proposed raising its quarterly dividend by 18%, from KZT850 to KZT1,000 per ADS, subject to shareholder approval.
Moat: A broad digital ecosystem connecting payments, commerce and financial services.
Opportunities: E-commerce growth, payments adoption, advertising, financial services and higher customer engagement.
Problems: The business operates in an emerging market and is exposed to Kazakhstan's economic, regulatory and currency environment.
Risks: Currency volatility, regulation, banking exposure and geopolitical uncertainty.
Investor takeaway: KSPI may be one of the most compelling high-yield dividend growth stocks on this screen, but investors should demand a higher risk premium because of its emerging-market exposure.
3. Comcast (NASDAQ: CMCSA)
Comcast offers a 4.92% dividend yield and an exceptionally low forward P/E of 7.47.
The company's traditional cable business faces structural challenges from cord-cutting and changing consumer behavior. However, Comcast still owns an enormous connectivity infrastructure and has opportunities in broadband, wireless and streaming.
The company has also been making progress with Peacock, which has reached profitability.
Moat: Broadband infrastructure, customer relationships and scale.
Opportunities: Wireless growth, broadband, Peacock and corporate restructuring.
Problems: Cable-video declines and intense competition in broadband and entertainment.
Risks: Cord-cutting, content costs, competition and execution risk.
Investor takeaway: CMCSA looks more like a value-and-income opportunity than a classic growth stock. The dividend is attractive, but investors need to believe management can successfully reposition the company.
4. Gold Fields (NYSE: GFI)
Gold Fields offers a 4.89% dividend yield and a forward P/E of 8.86.
Unlike most stocks on the list, Gold Fields gives investors direct exposure to gold prices.
The company's recent results demonstrate the powerful earnings leverage that miners can experience when gold prices are strong. Gold Fields reported an 81% year-over-year increase in first-half headline EPS and increased its interim dividend by 133%.
That sounds extremely attractive—but commodity-linked dividend growth needs to be viewed differently from the dividend growth of a software or consumer company.
Moat: Large-scale mining operations, reserves, infrastructure and operating expertise.
Opportunities: Higher gold prices, increased production and stronger free cash flow.
Problems: Mining costs and operational complexity.
Risks: Gold-price declines, inflation, production disruptions, labor issues and geopolitical risk.
Investor takeaway: GFI is an interesting gold-and-income stock, but investors should expect dividend payments to be much more cyclical.
5. TPG (NASDAQ: TPG)
TPG has a 4.51% dividend yield and a forward P/E of 14.63.
The alternative asset manager benefits from the long-term shift toward private equity, private credit, real estate and other alternative investments.
TPG reported strong second-quarter 2026 results and declared a quarterly dividend of $0.59 per share.
Moat: Brand, investment expertise, institutional relationships and scale.
Opportunities: Private credit, alternative investments, wealth distribution and international expansion.
Problems: Performance-related earnings can be volatile.
Risks: Weak fundraising, lower private-market valuations, difficult exit markets and increased competition.
Investor takeaway: TPG offers an attractive combination of alternative-asset exposure and shareholder income.
Other Dividend Stocks Worth Watching
The remaining names provide additional diversification.
H World Group (HTHT) offers exposure to China's growing lodging industry.
AngloGold Ashanti (AU) and Harmony Gold (HMY) provide additional exposure to gold prices and mining.
Accenture (ACN) is a more conventional technology-services dividend-growth candidate, benefiting from corporate digital transformation and AI spending.
Target (TGT) provides consumer exposure with a 2.43% yield, although investors need to watch sales trends and competition.
Thomson Reuters (TRI) has a potentially strong moat because professional customers depend on its information and workflow products.
Broadridge Financial Solutions (BR) benefits from deeply embedded financial-market infrastructure and high switching costs.
Barrick Mining (B) offers exposure to gold and copper.
Erie Indemnity (ERIE) provides exposure to insurance services and has a lower but potentially durable dividend.
Paramount Skydance (PSKY) is a more speculative media and entertainment turnaround opportunity.
Cognizant (CTSH) combines a low valuation with a 2.12% dividend yield and exposure to enterprise technology spending.
Becton Dickinson (BDX) offers healthcare exposure and a portfolio of medical devices.
Southern Copper (SCCO) is a long-term copper-demand play, although its valuation is considerably higher than several other mining names on this screen.
FactSet (FDS) has a recurring-revenue financial-data business and a strong customer-retention model.
Estée Lauder (EL) offers potential recovery upside, although its current yield is only 1.42%.
What Makes a Good Dividend Growth Stock?
Investors should not simply buy the highest-yielding stocks.
A sustainable dividend generally requires a company to have:
Growing or stable free cash flow
A manageable payout ratio
A strong balance sheet
A durable competitive advantage
Attractive long-term industry economics
The ability to reinvest in the business
This is why a stock yielding 2% with 10% annual dividend growth can potentially be more attractive over a long investment horizon than a stock yielding 8% but unable to grow its payout.
Final Thoughts
The September 2026 screen offers several compelling dividend opportunities.
Blue Owl Capital, Kaspi.kz, Comcast, Gold Fields and TPG are the five highest-yielding stocks on the list and deserve particular attention from income-focused investors.
However, each has a different risk profile.
OWL and TPG depend on the continued expansion of alternative assets. KSPI combines fintech growth with emerging-market risks. Comcast is a potential value turnaround. Gold Fields offers strong exposure to gold but comes with commodity-cycle risk.
For investors building a long-term dividend portfolio, the best strategy is to look beyond headline yield and examine dividend growth, free cash flow, valuation, competitive advantages and balance-sheet strength.
A high yield can be attractive—but a growing, sustainable dividend backed by a strong business is often what creates the most compelling long-term income opportunity.
This article is for informational purposes only and is not investment advice. Dividend yields, valuations and company fundamentals can change, and dividends are never guaranteed.
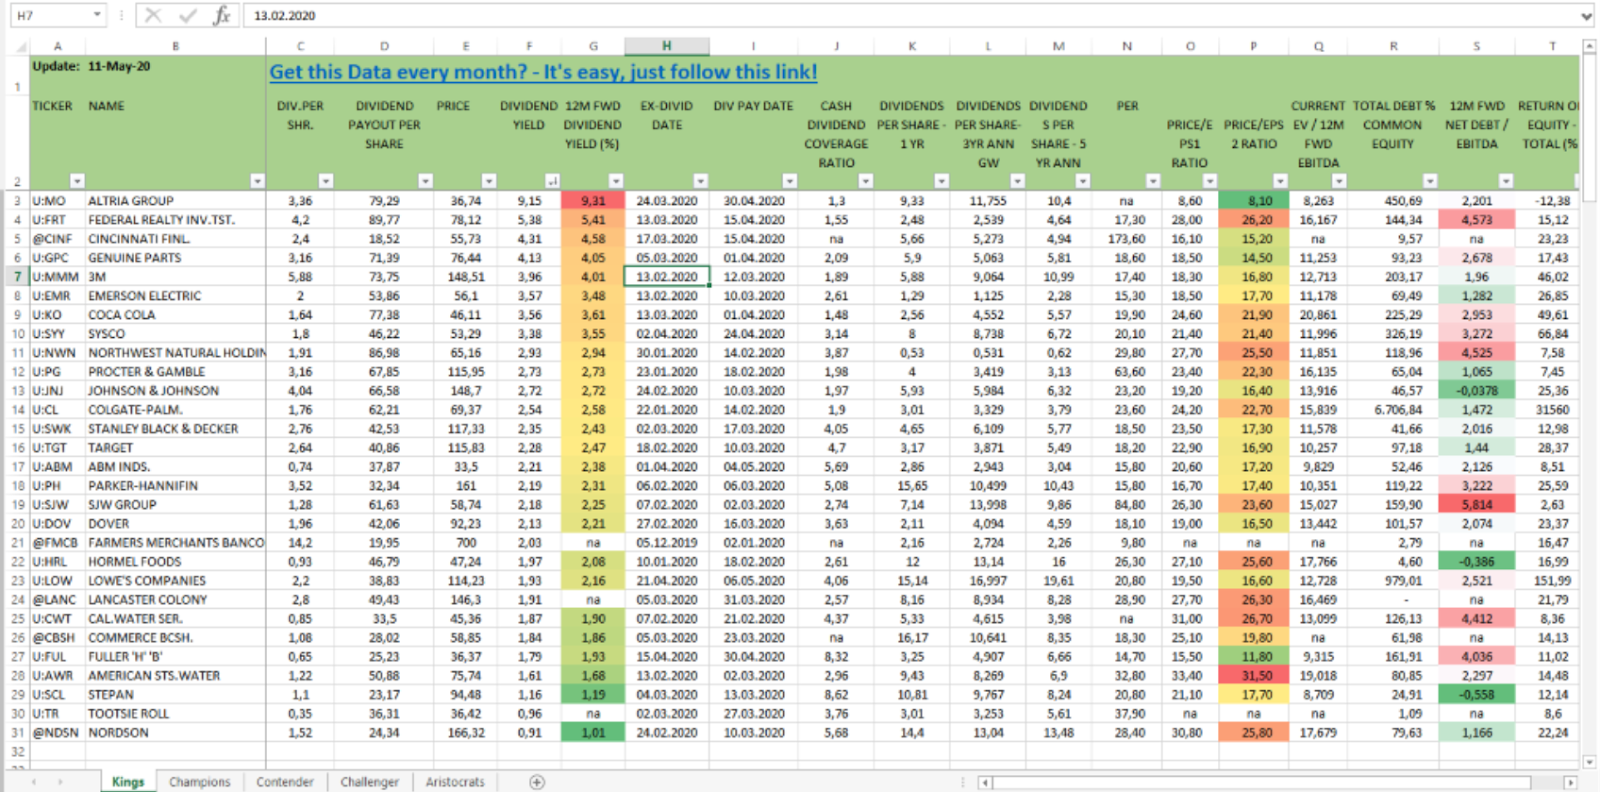
by the way...if you like this list and you want more tables like the above published, please help us now. Please read the following text to understand why we need your help. Thank you.You can use these lists to display, modify, calculate and sort important key figures such as the dividend yield, return on equity ratio, FCF-Yield or price-to-book-ratio. Over 40 ratios are available for sorting. The lists are updated once a month and will be free to use for all supporter on Steady.
INSERT_STEADY_CHECKOUT_HERE
With your support, the project can remain financially independent and can be further developed without annoying advertising or paywalls.
Thank you so much for your support! If you don't have the financial flexibility to help me, you can easily share this project or post with your social connections on Facebook, Twitter, Instagam, Pinterest or TikToc. It could be a great way to keep this site alive. Thank you so much.


