See below a list of the 20 biggest Dividend Contenders by Marketcapitalization. For a small donation, you can get the full list of Dividend Champs and Contenders.
| Ticker |
Company |
Market Cap |
P/E |
Fwd P/E |
P/S |
P/B |
Dividend |
| MSFT |
Microsoft Corporation |
778.00B |
27.88 |
25.01 |
7.51 |
9.76 |
1.67% |
| V |
Visa Inc. |
306.64B |
38.83 |
25.76 |
15.84 |
10.64 |
0.62% |
| VZ |
Verizon Communications Inc. |
202.47B |
14.25 |
10.64 |
1.58 |
4.02 |
4.74% |
| CMCSA |
Comcast Corporation |
156.50B |
15.36 |
12.34 |
1.8 |
2.25 |
2.25% |
| IBM |
International Business Machines |
130.07B |
11.89 |
10.01 |
1.62 |
7.16 |
4.45% |
| PM |
Philip Morris International Inc. |
124.52B |
16.42 |
14.02 |
4.21 |
- |
5.34% |
| NKE |
NIKE, Inc. |
118.11B |
31.76 |
27.35 |
3.35 |
12.18 |
1.09% |
| TXN |
Texas Instruments Incorporated |
112.22B |
28.06 |
18.75 |
7.31 |
10.37 |
2.21% |
| UNP |
Union Pacific Corporation |
111.69B |
22.4 |
16.67 |
5.18 |
4.58 |
2.03% |
| ACN |
Accenture plc |
103.00B |
27.07 |
21.82 |
2.63 |
10.19 |
1.67% |
| UTX |
United Technologies Corporation |
99.29B |
19.19 |
15.99 |
1.62 |
3.23 |
2.24% |
| COST |
Costco Wholesale Corporation |
92.62B |
32.36 |
27.39 |
0.66 |
7.63 |
1.08% |
| QCOM |
QUALCOMM Incorporated |
86.67B |
- |
16.69 |
3.83 |
3.64 |
4.24% |
| LMT |
Lockheed Martin Corporation |
85.47B |
20.64 |
16.31 |
1.66 |
- |
2.67% |
| CAT |
Caterpillar Inc. |
84.32B |
18.3 |
11.62 |
1.74 |
5.5 |
2.23% |
| HDB |
HDFC Bank Limited |
82.95B |
39.01 |
24.09 |
7.13 |
5.58 |
0.48% |
| NEE |
NextEra Energy, Inc. |
77.34B |
13.24 |
19.66 |
4.53 |
2.36 |
2.70% |
| CVS |
CVS Health Corporation |
73.33B |
14.31 |
9.96 |
0.39 |
1.9 |
2.77% |
| OXY |
Occidental Petroleum Corporation |
64.55B |
33.9 |
19.03 |
4.78 |
3.08 |
3.70% |
| FDX |
FedEx Corporation |
63.71B |
19.84 |
13.89 |
1 |
3.43 |
1.08% |
This is only a small part of the full Dividend Yield Investor Fact Book Package you can get for a small donation.
The full package contains excel
sheets of essential financial ratios from all 113 Dividend Champions (over 25 years of constant dividend growth) and
204 Dividend Contenders (10 to 24
years of consecutive dividend growth). It's an open version, so you can work
with it very easily.
In addition, you get also a Foreign Yield Factbook with content tables of the highest yielding stocks from the most important economies in the world.
For a small donation, we send you every update from the Fact Books direct to your donation e-mail adress.
A donation from you can helps us to develop this books and improve the
quality of the work. Together we can make the world a better and smarter place.
A place with no information advantage between poor and rich persons who have
enough budget to buy the expensive data from Reuters and Bloomberg.
The Dividend Yield Fact Book compilation contains the following books
and one Excel Sheet with financial ratios form all Dividend Champions and
Dividend Contenders. Here is what you get for your donation:
Monthly updated Factbooks and Excelsheets
- Foreign Yield Fact Book - 42 Pages PDF
- Dividend Growth Stock Fact Book - 32 Pages PDF
- Dividend Growth Excel Sheet of Dividend Champions and Dividend Contenders
These books and Excel Sheets are frequently updated and keeps you up-to date with current yield figures from the best Dividend Growth Stocks. Here is a preview of the content:
There is no donation minimum or limit. You can choose the donation amount you want to give. The more you support us, the more we can create and give back to you. We think this is a fair deal.
Every donation, even a tiny one, helps us to keep this blog free available for everyone. Help us to support people with no income or big budget to get free and easy information on the web. Thank you.
----Bonus for your donation----
Special Reports if released:
#1 Get an overview about the best yielding stocks of the world with the Foreign Yield Database for a special country
Check out more details here: Foreign Yield Factbook and Excelsheet.
Here is a preview of Canada:
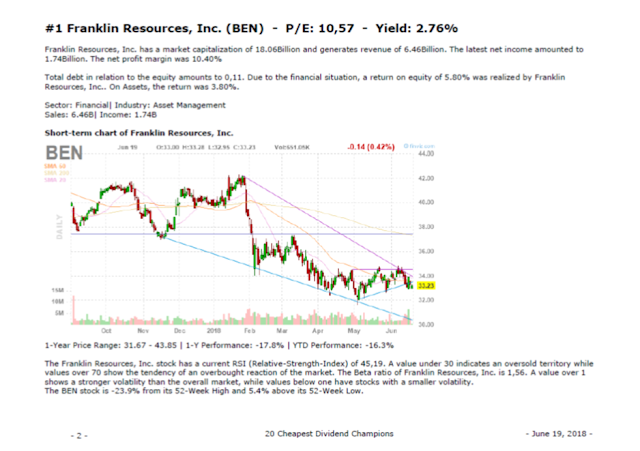
#2 Receive Corporate Factbooks from Dividend Champions to stay up-to-date
See more details here: Corporate Factbooks
Example from Altria:
#3 - Get Factbook Compilations around interesting investing themes like Dogs of the Dow
Find more details here: Factbook compilation around investment themes
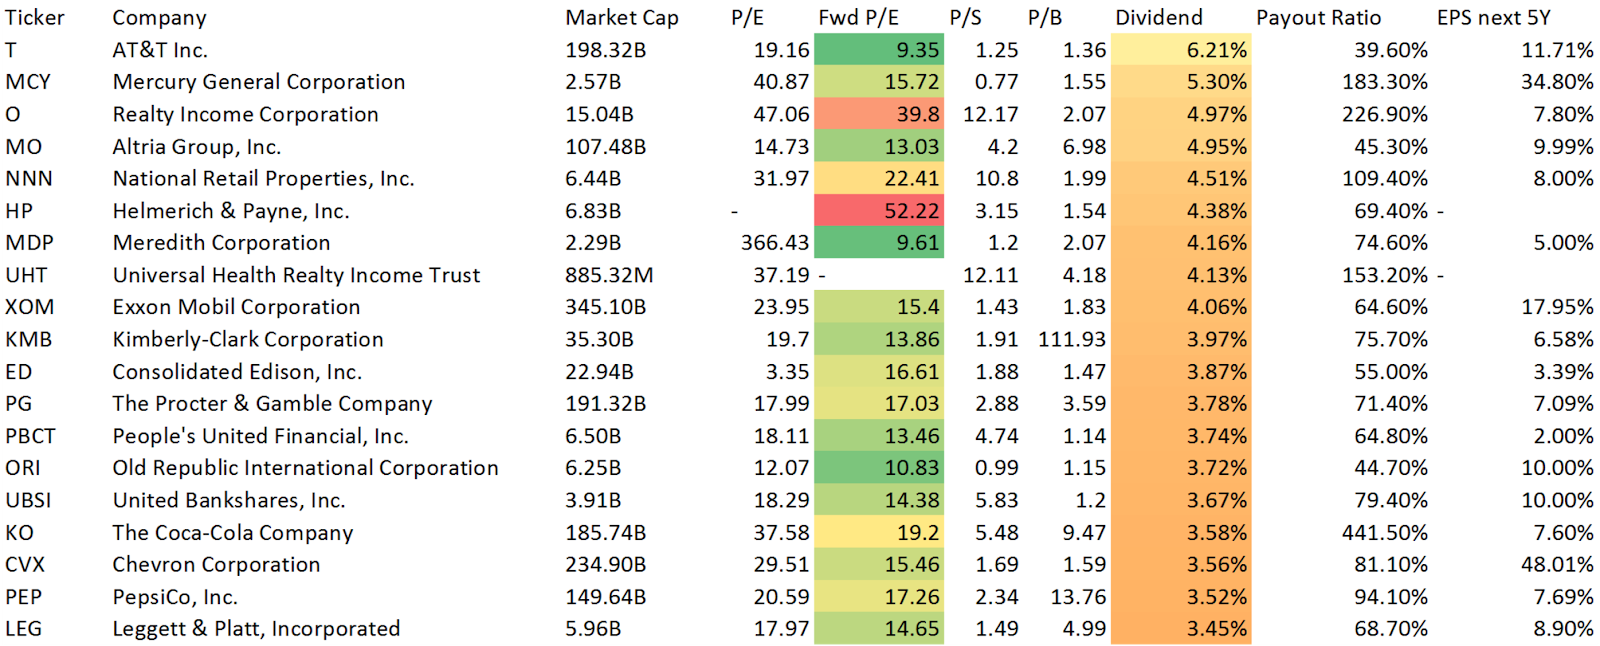
Here is a preview of the 20 Cheapest Dividend Champions:
You get all this stuff for a small donation. There is no minimum or limit to donate. You can choose how much you like to support us. The more you give, the more we can give back to you. That's a fair deal in our view.

Thank you very much for your help. Thank YOU, it's a great pleasure!!!