Bookmark and Share
Showing posts sorted by date for query B. Sort by relevance Show all posts

20 Top Yielding Dividend Growth Stocks to Watch in September 2026

Investors searching for dividend growth stocks to watch in September 2026 have plenty of interesting candidates to consider.

Our latest screen highlights 20 companies with dividend yields ranging from 1.42% to 7.92%, including high-yield names such as Blue Owl Capital, Kaspi.kz, Comcast, Gold Fields and TPG.

But dividend yield alone does not tell the whole story. Investors should also consider valuation, free cash flow, competitive advantages, growth opportunities and the risks that could threaten future dividend payments.

20 Dividend Growth Stocks on the Watchlist

RankTickerCompanyDividend YieldForward P/E
1OWLBlue Owl Capital7.92%11.83
2KSPIKaspi.kz7.26%7.28
3CMCSAComcast4.92%7.47
4GFIGold Fields4.89%8.86
5TPGTPG4.51%14.63
6HTHTH World Group4.26%16.12
7AUAngloGold Ashanti4.02%12.90
8HMYHarmony Gold3.57%6.25
9ACNAccenture3.48%12.71
10TGTTarget2.43%17.75
11TRIThomson Reuters2.36%21.43
12BRBroadridge Financial Solutions2.32%16.04
13BBarrick Mining2.30%11.69
14ERIEErie Indemnity2.18%N/A
15PSKYParamount Skydance2.13%12.66
16CTSHCognizant Technology Solutions2.12%9.85
17BDXBecton Dickinson2.09%14.35
18SCCOSouthern Copper1.87%30.48
19FDSFactSet Research Systems1.48%15.57
20ELEstée Lauder1.42%26.41

5 Dividend Stocks That Stand Out

1. Blue Owl Capital (NYSE: OWL)

Blue Owl Capital has the highest dividend yield on the screen at 7.92%.

The alternative asset manager is positioned to benefit from the continued expansion of private credit and other alternative investments. Its recurring management-fee model can provide a strong foundation for shareholder distributions.

The key attraction is the combination of a high starting yield and potential dividend growth as assets under management and distributable earnings expand.

Moat: Scale, investment capabilities, institutional relationships and recurring fee revenue.

Opportunities: Growth in private markets, private credit and wealth-management distribution.

Problems: Earnings can be affected by fundraising conditions, asset valuations and performance-related revenue.

Risks: A prolonged market downturn could slow fundraising, reduce assets under management and pressure earnings.

Investor takeaway: OWL is one of the most interesting names for investors seeking high dividend yield plus potential dividend growth, although its business is more cyclical than a traditional defensive dividend stock.


2. Kaspi.kz (NASDAQ: KSPI)

Kaspi.kz combines a remarkable 7.26% dividend yield with a forward P/E of only 7.28.

The company operates a digital ecosystem covering payments, e-commerce and financial services. This combination can create powerful customer relationships and multiple opportunities to monetize user activity.

Kaspi also stands out for dividend-growth potential. The company proposed raising its quarterly dividend by 18%, from KZT850 to KZT1,000 per ADS, subject to shareholder approval.

Moat: A broad digital ecosystem connecting payments, commerce and financial services.

Opportunities: E-commerce growth, payments adoption, advertising, financial services and higher customer engagement.

Problems: The business operates in an emerging market and is exposed to Kazakhstan's economic, regulatory and currency environment.

Risks: Currency volatility, regulation, banking exposure and geopolitical uncertainty.

Investor takeaway: KSPI may be one of the most compelling high-yield dividend growth stocks on this screen, but investors should demand a higher risk premium because of its emerging-market exposure.


3. Comcast (NASDAQ: CMCSA)

Comcast offers a 4.92% dividend yield and an exceptionally low forward P/E of 7.47.

The company's traditional cable business faces structural challenges from cord-cutting and changing consumer behavior. However, Comcast still owns an enormous connectivity infrastructure and has opportunities in broadband, wireless and streaming.

The company has also been making progress with Peacock, which has reached profitability.

Moat: Broadband infrastructure, customer relationships and scale.

Opportunities: Wireless growth, broadband, Peacock and corporate restructuring.

Problems: Cable-video declines and intense competition in broadband and entertainment.

Risks: Cord-cutting, content costs, competition and execution risk.

Investor takeaway: CMCSA looks more like a value-and-income opportunity than a classic growth stock. The dividend is attractive, but investors need to believe management can successfully reposition the company.


4. Gold Fields (NYSE: GFI)

Gold Fields offers a 4.89% dividend yield and a forward P/E of 8.86.

Unlike most stocks on the list, Gold Fields gives investors direct exposure to gold prices.

The company's recent results demonstrate the powerful earnings leverage that miners can experience when gold prices are strong. Gold Fields reported an 81% year-over-year increase in first-half headline EPS and increased its interim dividend by 133%.

That sounds extremely attractive—but commodity-linked dividend growth needs to be viewed differently from the dividend growth of a software or consumer company.

Moat: Large-scale mining operations, reserves, infrastructure and operating expertise.

Opportunities: Higher gold prices, increased production and stronger free cash flow.

Problems: Mining costs and operational complexity.

Risks: Gold-price declines, inflation, production disruptions, labor issues and geopolitical risk.

Investor takeaway: GFI is an interesting gold-and-income stock, but investors should expect dividend payments to be much more cyclical.


5. TPG (NASDAQ: TPG)

TPG has a 4.51% dividend yield and a forward P/E of 14.63.

The alternative asset manager benefits from the long-term shift toward private equity, private credit, real estate and other alternative investments.

TPG reported strong second-quarter 2026 results and declared a quarterly dividend of $0.59 per share.

Moat: Brand, investment expertise, institutional relationships and scale.

Opportunities: Private credit, alternative investments, wealth distribution and international expansion.

Problems: Performance-related earnings can be volatile.

Risks: Weak fundraising, lower private-market valuations, difficult exit markets and increased competition.

Investor takeaway: TPG offers an attractive combination of alternative-asset exposure and shareholder income.

Other Dividend Stocks Worth Watching

The remaining names provide additional diversification.

H World Group (HTHT) offers exposure to China's growing lodging industry.

AngloGold Ashanti (AU) and Harmony Gold (HMY) provide additional exposure to gold prices and mining.

Accenture (ACN) is a more conventional technology-services dividend-growth candidate, benefiting from corporate digital transformation and AI spending.

Target (TGT) provides consumer exposure with a 2.43% yield, although investors need to watch sales trends and competition.

Thomson Reuters (TRI) has a potentially strong moat because professional customers depend on its information and workflow products.

Broadridge Financial Solutions (BR) benefits from deeply embedded financial-market infrastructure and high switching costs.

Barrick Mining (B) offers exposure to gold and copper.

Erie Indemnity (ERIE) provides exposure to insurance services and has a lower but potentially durable dividend.

Paramount Skydance (PSKY) is a more speculative media and entertainment turnaround opportunity.

Cognizant (CTSH) combines a low valuation with a 2.12% dividend yield and exposure to enterprise technology spending.

Becton Dickinson (BDX) offers healthcare exposure and a portfolio of medical devices.

Southern Copper (SCCO) is a long-term copper-demand play, although its valuation is considerably higher than several other mining names on this screen.

FactSet (FDS) has a recurring-revenue financial-data business and a strong customer-retention model.

Estée Lauder (EL) offers potential recovery upside, although its current yield is only 1.42%.

What Makes a Good Dividend Growth Stock?

Investors should not simply buy the highest-yielding stocks.

A sustainable dividend generally requires a company to have:

  • Growing or stable free cash flow

  • A manageable payout ratio

  • A strong balance sheet

  • A durable competitive advantage

  • Attractive long-term industry economics

  • The ability to reinvest in the business

This is why a stock yielding 2% with 10% annual dividend growth can potentially be more attractive over a long investment horizon than a stock yielding 8% but unable to grow its payout.

Final Thoughts

The September 2026 screen offers several compelling dividend opportunities.

Blue Owl Capital, Kaspi.kz, Comcast, Gold Fields and TPG are the five highest-yielding stocks on the list and deserve particular attention from income-focused investors.

However, each has a different risk profile.

OWL and TPG depend on the continued expansion of alternative assets. KSPI combines fintech growth with emerging-market risks. Comcast is a potential value turnaround. Gold Fields offers strong exposure to gold but comes with commodity-cycle risk.

For investors building a long-term dividend portfolio, the best strategy is to look beyond headline yield and examine dividend growth, free cash flow, valuation, competitive advantages and balance-sheet strength.

A high yield can be attractive—but a growing, sustainable dividend backed by a strong business is often what creates the most compelling long-term income opportunity.

This article is for informational purposes only and is not investment advice. Dividend yields, valuations and company fundamentals can change, and dividends are never guaranteed.

by the way...if you like this list and you want more tables like the above published, please help us now. 
Please read the following text to understand why we need your help. Thank you.

I've been working on this blog for years, without much success. But many people got a lot of inspirational information from my work - for free. I think that's good, but unfortunately I have my own expenses, a wife and children. That's why I need your support to keep the blog up and running.

You can easily support our project on the crowdfunding platform Steady. It's an alternative to Patreon. 

As a small gift for your support, you will receive monthly updated lists of the best dividend growth stocks in the world -- stock lists from USA, Canada and Japan with over 1.100 long-term dividend growth stocks.

You can use these lists to display, modify, calculate and sort important key figures such as the dividend yield, return on equity ratio, FCF-Yield or price-to-book-ratio. Over 40 ratios are available for sorting. The lists are updated once a month and will be free to use for all supporter on Steady.
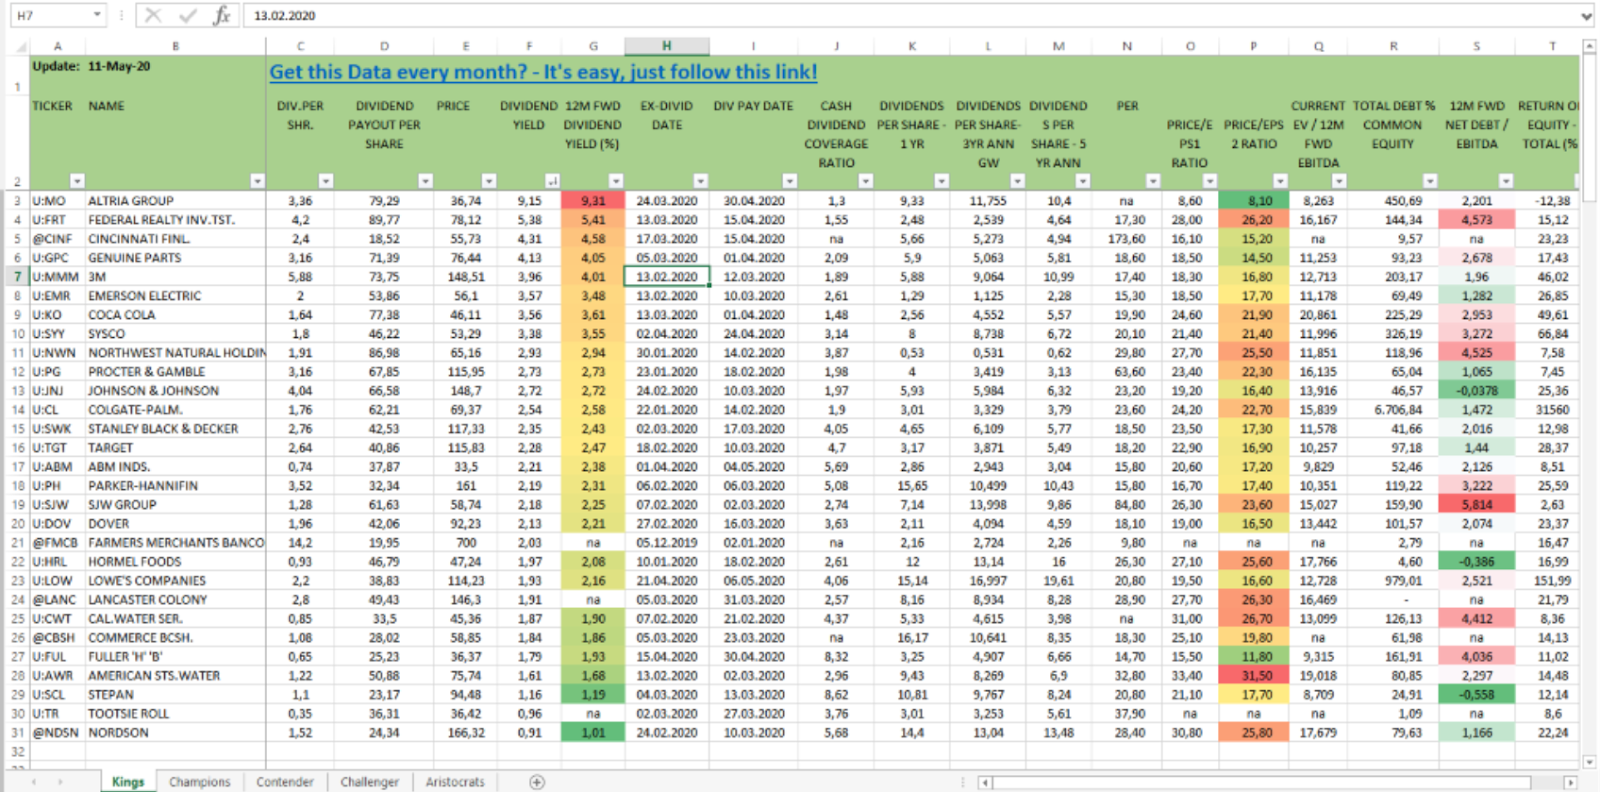


If you want to know how the Excel-Spreadsheet looks like, you can view a sample file on Google Spreadsheets. Just follow the link and you get an idea how it works for you. 

As I said, this is just a sample file. With your help, these Excel-Spreadsheets can be developed further. All I need is a support from you. Please participate in one of the programs listed below and support our project.

INSERT_STEADY_CHECKOUT_HERE

With your support, the project can remain financially independent and can be further developed without annoying advertising or paywalls.

Thank you so much for your support! If you don't have the financial flexibility to help me, you can easily share this project or post with your social connections on Facebook, Twitter, Instagam, Pinterest or TikToc. It could be a great way to keep this site alive. Thank you so much.

Why Steady?

Steady is a crowdfunding platform for creatives, photographers, journalists and content creators. All of these groups have the same problem: they do an honest job but have no way to monetize it. At the same time, they do not advertise or get support from partners in order to maintain their independence.

Steady gives us the opportunity to receive regular support for project implementation. In this way, the internet can continue to exist as a free medium of opinion.

If you are unable to support us financially, we are not worry. You can also help us by telling your friends about us on Facebook, Twitter, Instagram, Tik Tok or another social channel. The more support we have, the more we can invest in the content and expand the database. Thank you so much!

Verizon ($VZ) — Quick Analysis Summary #Verizon #Stock #Analysis

Price & Valuation (as of Aug 21, 2026)

  • Trading at $49.45, near its 52-week high of $51.68 (52-week low: $38.39)
  • Market cap: ~$205 billion
  • Trailing P/E: ~12.8x; normalized P/E (Morningstar): ~10.1x — well below the S&P 500 average
  • Analyst price targets range $44–$71, average $51.56 (~4–5% implied upside)
  • Consensus rating: Buy, with no analysts recommending Sell

Business Mix

  • Two segments: Consumer (wireless, FWA broadband, Fios) and Business (enterprise wireless/wireline, IoT, managed services)
  • ~75% of service revenue comes from wireless
  • Largest US carrier by subscribers (~146M), ahead of T-Mobile (~140M) and AT&T (~119M)

Q2 2026 Highlights

  • Mobility & Broadband revenue: $23.4B (+2.8% YoY); total revenue $34.3B (-0.7% YoY)
  • Adjusted EPS: $1.30 (+6.6% YoY)
  • Free cash flow: $6.4B in the quarter (+24% YoY)
  • Net adds: 184K postpaid phone, 348K broadband
  • Raised FY2026 guidance: M&B revenue growth 2.5–3%, adjusted EPS +6–7%, FCF growth 9–10%
  • Buyback increased to up to $4.5B; capex guide $16–16.5B

Growth Drivers

  • Frontier Communications acquisition (fiber/rural expansion)
  • AI infrastructure: dark-fiber deals with hyperscalers (e.g., >$1B Google deal), meaningful revenue expected from 2027
  • 50/50 international wireline JV with BT

Key Risks

  • High leverage; deleveraging target not until 2027
  • Intense competition from T-Mobile and cable MVNOs (Comcast/Charter captured ~45% of new wireless subs in 2025)
  • Integration risk from Frontier/Starry acquisitions
  • Cybersecurity exposure (e.g., "Salt Typhoon" state-linked attacks)
  • Potential higher labor costs from 2026 union contract negotiations

Dividend

  • Yield: ~5.53% (10-year average: 5.13%)
  • Payout ratio (3-yr): ~73.4%
  • 10-year unbroken continuity
  • 5-year dividend growth: only ~1.94% — the weak spot in an otherwise strong dividend profile (13/15 score)

Bottom line: Verizon reads as a value/income stock with a stabilizing operational story — improving cash flow, raised guidance, and a well-covered high dividend — but with modest growth and only limited near-term upside per analyst targets. Leverage and competitive intensity remain the key overhangs.

by the way...if you like this list and you want more tables like the above published, please help us now. 
Please read the following text to understand why we need your help. Thank you.

I've been working on this blog for years, without much success. But many people got a lot of inspirational information from my work - for free. I think that's good, but unfortunately I have my own expenses, a wife and children. That's why I need your support to keep the blog up and running.

You can easily support our project on the crowdfunding platform Steady. It's an alternative to Patreon. 

As a small gift for your support, you will receive monthly updated lists of the best dividend growth stocks in the world -- stock lists from USA, Canada and Japan with over 1.100 long-term dividend growth stocks.

You can use these lists to display, modify, calculate and sort important key figures such as the dividend yield, return on equity ratio, FCF-Yield or price-to-book-ratio. Over 40 ratios are available for sorting. The lists are updated once a month and will be free to use for all supporter on Steady.


If you want to know how the Excel-Spreadsheet looks like, you can view a sample file on Google Spreadsheets. Just follow the link and you get an idea how it works for you. 

As I said, this is just a sample file. With your help, these Excel-Spreadsheets can be developed further. All I need is a support from you. Please participate in one of the programs listed below and support our project.

INSERT_STEADY_CHECKOUT_HERE

With your support, the project can remain financially independent and can be further developed without annoying advertising or paywalls.

Thank you so much for your support! If you don't have the financial flexibility to help me, you can easily share this project or post with your social connections on Facebook, Twitter, Instagam, Pinterest or TikToc. It could be a great way to keep this site alive. Thank you so much.

Why Steady?

Steady is a crowdfunding platform for creatives, photographers, journalists and content creators. All of these groups have the same problem: they do an honest job but have no way to monetize it. At the same time, they do not advertise or get support from partners in order to maintain their independence.

Steady gives us the opportunity to receive regular support for project implementation. In this way, the internet can continue to exist as a free medium of opinion.

If you are unable to support us financially, we are not worry. You can also help us by telling your friends about us on Facebook, Twitter, Instagram, Tik Tok or another social channel. The more support we have, the more we can invest in the content and expand the database. Thank you so much!

Dividend Aristocrats with low P/B Ratios -- $T $BEN $AFL $WBA $CB $CINF

Dear Reader, please find below a list of Dividend Aristocrats with low P/B Ratios -- $T $BEN $AFL $WBA $CB $CINF are the top results. Stocks with a low price-to-book ratio could be fundamentally cheap. Do you have any favorites from the list below?


by the way...if you like this list and you want more tables like the above published, please help us now. 
Please read the following text to understand why we need your help. Thank you.

I've been working on this blog for years, without much success. But many people got a lot of inspirational information from my work - for free. I think that's good, but unfortunately I have my own expenses, a wife and children. That's why I need your support to keep the blog up and running.

You can easily support our project on the crowdfunding platform Steady. It's an alternative to Patreon. 

As a small gift for your support, you will receive monthly updated lists of the best dividend growth stocks in the world -- stock lists from USA, Canada and Japan with over 1.100 long-term dividend growth stocks.

You can use these lists to display, modify, calculate and sort important key figures such as the dividend yield, return on equity ratio, FCF-Yield or price-to-book-ratio. Over 40 ratios are available for sorting. The lists are updated once a month and will be free to use for all supporter on Steady.


If you want to know how the Excel-Spreadsheet looks like, you can view a sample file on Google Spreadsheets. Just follow the link and you get an idea how it works for you. 

As I said, this is just a sample file. With your help, these Excel-Spreadsheets can be developed further. All I need is a support from you. Please participate in one of the programs listed below and support our project.

INSERT_STEADY_CHECKOUT_HERE

With your support, the project can remain financially independent and can be further developed without annoying advertising or paywalls.

Thank you so much for your support! If you don't have the financial flexibility to help me, you can easily share this project or post with your social connections on Facebook, Twitter, Instagam, Pinterest or TikToc. It could be a great way to keep this site alive. Thank you so much.
Why Steady?

Steady is a crowdfunding platform for creatives, photographers, journalists and content creators. All of these groups have the same problem: they do an honest job but have no way to monetize it. At the same time, they do not advertise or get support from partners in order to maintain their independence.

Steady gives us the opportunity to receive regular support for project implementation. In this way, the internet can continue to exist as a free medium of opinion.

If you are unable to support us financially, we are not worry. You can also help us by telling your friends about us on Facebook, Twitter, Instagram, Tik Tok or another social channel. The more support we have, the more we can invest in the content and expand the database. Thank you so much!

Best Dividend Kings - $MO $MMM $JNJ

Finding the Best Dividend Kings is difficult. Nevertheless, I would like to give you a try today and introduce you to the Best Dividend Kings.

Today I focused on the dividend kings category. Such stocks have increased their dividends uninterruptedly over a period of 50+ years dividends. There are currently exactly 29 stocks that match this.

Best Dividend Kings

Best Dividend Kings are some of the following stocks:

  • Altria

  • 3M

  • Johnson & Johnson

  • Emerson Electric

  • Lowe’s

  • ...

As a supporter of my work, you can view the full list for free. It took me a lot of work to create it. It would be nice if you would support me so that I can continue to do good work for you in the future.

The table consists of 29 Best Dividend Kings and is also available as an Excel download. At the end of the article you will find the link that will allow you to download the file of all Dividend Kings. 


As an active supporter, you get further every month a sheet with the best long-term dividend growth stocks in the World (USA, CANADA and JAPAN). That’s an Excel-File with over 1,000 long-term dividend growth stocks.


Analyse the best Dividend Kings by the following criteria:


  • Ticker

  • Company

  • Industry

  • Market Capitalization

  • Forward P/E

  • P/S

  • P/B

  • Dividend Yield

  • EPS next 5 Years

  • Sales past 5 Years

  • Sales Q/Q

  • Return on Assets

  • Return on Equity

  • Debt/Equity

  • Gross Margin

  • Oper Margin

  • Profit Margin

  • One Year Performance

  • Beta

  • Price

  • Analyst Target Price

Best Dividend Kings List


You might like this articles too:

Please support my work and see the full table about the best Dividend Kings....

___STEADY_PAYWALL___

Here is a preview of the table.

Dividend Kings

Dividend Kings II

Top Results by Yield

TickerCompanyYield
MOAltria Group, Inc.8.52%
FRTFederal Realty Investment Trust4.66%
NFGNational Fuel Gas Company4.18%
NWNNorthwest Natural Holding Company3.78%
MMM3M Company3.32%
GPCGenuine Parts Company3.19%
KOThe Coca-Cola Company3.10%
CINFCincinnati Financial Corporation3.06%
JNJJohnson & Johnson2.81%
EMREmerson Electric Co.2.58%
SYYSysco Corporation2.51%
PGThe Procter & Gamble Company2.28%
CLColgate-Palmolive Company2.08%
HRLHormel Foods Corporation1.98%
SJWSJW Group1.90%
ABMABM Industries Incorporated1.84%
AWRAmerican States Water Company1.76%
LANCLancaster Colony Corporation1.75%
CWTCalifornia Water Service Group1.67%
DOVDover Corporation1.60%
CBSHCommerce Bancshares, Inc.1.56%
LOWLowe's Companies, Inc.1.55%
TGTTarget Corporation1.51%
SWKStanley Black & Decker, Inc.1.50%
PHParker-Hannifin Corporation1.28%
FULH.B. Fuller Company1.22%
TRTootsie Roll Industries, Inc.1.14%
SCLStepan Company1.03%
NDSNNordson Corporation0.77%

Best Dividend Kings by forward P/E

TickerCompanyPE Expected
MOAltria Group, Inc.8.79
FRTFederal Realty Investment Trust45.52
NFGNational Fuel Gas Company10.12
NWNNorthwest Natural Holding Company19.89
MMM3M Company18.74
GPCGenuine Parts Company17.18
KOThe Coca-Cola Company25.09
CINFCincinnati Financial Corporation20.60
JNJJohnson & Johnson15.97
EMREmerson Electric Co.19.89
SYYSysco Corporation22.63
PGThe Procter & Gamble Company23.45
CLColgate-Palmolive Company26.27
HRLHormel Foods Corporation25.65
SJWSJW Group28.04
ABMABM Industries Incorporated17.39
AWRAmerican States Water Company31.71
LANCLancaster Colony Corporation29.28
CWTCalifornia Water Service Group29.64
DOVDover Corporation20.11
CBSHCommerce Bancshares, Inc.20.01
LOWLowe's Companies, Inc.17.64
TGTTarget Corporation21.30
SWKStanley Black & Decker, Inc.19.63
PHParker-Hannifin Corporation19.34
FULH.B. Fuller Company16.53
TRTootsie Roll Industries, Inc.-
SCLStepan Company18.91
NDSNNordson Corporation31.54

Stocks with best P/S Ratio

TickerCompanyP/S
ABMABM Industries Incorporated0.44
SYYSysco Corporation0.76
GPCGenuine Parts Company0.85
FULH.B. Fuller Company1.00
TGTTarget Corporation1.01
SCLStepan Company1.46
LOWLowe's Companies, Inc.1.58
CINFCincinnati Financial Corporation1.83
NWNNorthwest Natural Holding Company2.03
SWKStanley Black & Decker, Inc.2.16
NFGNational Fuel Gas Company2.52
HRLHormel Foods Corporation2.60
PHParker-Hannifin Corporation2.61
DOVDover Corporation2.70
EMREmerson Electric Co.2.83
MOAltria Group, Inc.2.91
MMM3M Company3.20
CWTCalifornia Water Service Group3.23
SJWSJW Group3.44
LANCLancaster Colony Corporation3.51
TRTootsie Roll Industries, Inc.4.28
CLColgate-Palmolive Company4.51
JNJJohnson & Johnson4.70
PGThe Procter & Gamble Company4.73
NDSNNordson Corporation5.48
AWRAmerican States Water Company5.82
KOThe Coca-Cola Company6.86
FRTFederal Realty Investment Trust8.14
CBSHCommerce Bancshares, Inc.8.69

Stocks with best P/B Ratio

TickerCompanyP/B
CINFCincinnati Financial Corporation1.30
NFGNational Fuel Gas Company1.68
NWNNorthwest Natural Holding Company1.82
ABMABM Industries Incorporated1.86
SJWSJW Group2.11
FULH.B. Fuller Company2.12
CBSHCommerce Bancshares, Inc.2.31
TRTootsie Roll Industries, Inc.2.75
CWTCalifornia Water Service Group2.84
SCLStepan Company2.89
FRTFederal Realty Investment Trust3.17
SWKStanley Black & Decker, Inc.3.29
HRLHormel Foods Corporation4.03
AWRAmerican States Water Company4.42
GPCGenuine Parts Company4.74
PHParker-Hannifin Corporation5.40
DOVDover Corporation5.51
EMREmerson Electric Co.5.56
LANCLancaster Colony Corporation5.87
JNJJohnson & Johnson5.87
NDSNNordson Corporation6.60
TGTTarget Corporation7.15
PGThe Procter & Gamble Company7.29
MMM3M Company8.61
KOThe Coca-Cola Company12.22
MOAltria Group, Inc.23.89
LOWLowe's Companies, Inc.26.75
SYYSysco Corporation28.11
CLColgate-Palmolive Company111.51

Dividend Kings By EPS-Growth Expected


TickerCompanyExpected EPS Growth Next 5Y
SYYSysco Corporation25.13%
LOWLowe's Companies, Inc.20.58%
ABMABM Industries Incorporated16.00%
SJWSJW Group13.70%
TGTTarget Corporation13.05%
NDSNNordson Corporation13.00%
CWTCalifornia Water Service Group10.75%
TRTootsie Roll Industries, Inc.9.00%
PHParker-Hannifin Corporation8.82%
NFGNational Fuel Gas Company8.50%
PGThe Procter & Gamble Company8.47%
FULH.B. Fuller Company8.01%
SWKStanley Black & Decker, Inc.7.81%
FRTFederal Realty Investment Trust6.70%
CLColgate-Palmolive Company6.67%
MOAltria Group, Inc.5.60%
AWRAmerican States Water Company4.85%
SCLStepan Company4.40%
JNJJohnson & Johnson4.38%
MMM3M Company3.66%
DOVDover Corporation3.45%
KOThe Coca-Cola Company3.34%
NWNNorthwest Natural Holding Company3.10%
LANCLancaster Colony Corporation3.00%
EMREmerson Electric Co.2.97%
HRLHormel Foods Corporation1.00%
GPCGenuine Parts Company-1.10%
CINFCincinnati Financial Corporation-3.33%
CBSHCommerce Bancshares, Inc.-8.70%

Stocks with best Sales Growth

TickerCompanySales past 5Y
CINFCincinnati Financial Corporation9.90%
CBSHCommerce Bancshares, Inc.7.40%
ABMABM Industries Incorporated6.90%
FULH.B. Fuller Company6.60%
FRTFederal Realty Investment Trust6.40%
SJWSJW Group5.60%
NDSNNordson Corporation5.20%
LOWLowe's Companies, Inc.5.10%
SWKStanley Black & Decker, Inc.5.00%
GPCGenuine Parts Company4.80%
LANCLancaster Colony Corporation3.90%
CWTCalifornia Water Service Group3.60%
JNJJohnson & Johnson2.00%
SYYSysco Corporation1.70%
TGTTarget Corporation1.50%
PHParker-Hannifin Corporation1.50%
EMREmerson Electric Co.0.70%
MOAltria Group, Inc.0.50%
HRLHormel Foods Corporation0.40%
AWRAmerican States Water Company0.30%
MMM3M Company0.20%
PGThe Procter & Gamble Company0.10%
NWNNorthwest Natural Holding Company-0.20%
TRTootsie Roll Industries, Inc.-0.60%
SCLStepan Company-0.70%
DOVDover Corporation-1.60%
CLColgate-Palmolive Company-1.90%
KOThe Coca-Cola Company-4.10%
NFGNational Fuel Gas Company-4.30%

Highest Return on Assets

TickerCompanyROA
LANCLancaster Colony Corporation-
CLColgate-Palmolive Company17.70%
PGThe Procter & Gamble Company11.50%
MMM3M Company10.90%
HRLHormel Foods Corporation10.80%
JNJJohnson & Johnson10.60%
LOWLowe's Companies, Inc.10.30%
NDSNNordson Corporation9.10%
EMREmerson Electric Co.9.00%
KOThe Coca-Cola Company9.00%
SCLStepan Company7.60%
DOVDover Corporation7.50%
TGTTarget Corporation6.20%
TRTootsie Roll Industries, Inc.6.00%
PHParker-Hannifin Corporation5.90%
AWRAmerican States Water Company4.80%
SWKStanley Black & Decker, Inc.4.30%
CINFCincinnati Financial Corporation3.20%
FULH.B. Fuller Company2.90%
CWTCalifornia Water Service Group2.80%
FRTFederal Realty Investment Trust2.30%
NWNNorthwest Natural Holding Company1.70%
MOAltria Group, Inc.1.50%
NFGNational Fuel Gas Company1.40%
SJWSJW Group1.30%
CBSHCommerce Bancshares, Inc.1.10%
ABMABM Industries Incorporated-0.10%
SYYSysco Corporation-0.10%
GPCGenuine Parts Company-1.40%


Excel-File Download
Best Dividend Kings: Download.

See the file in the Cloud: Top Dividend Kings.

You may also like:

Did you enjoy reading my article about Best Dividend Kings? If so, then please help us and share this article as a basis for discussion. We are already looking forward to an exciting and controversial discussion.