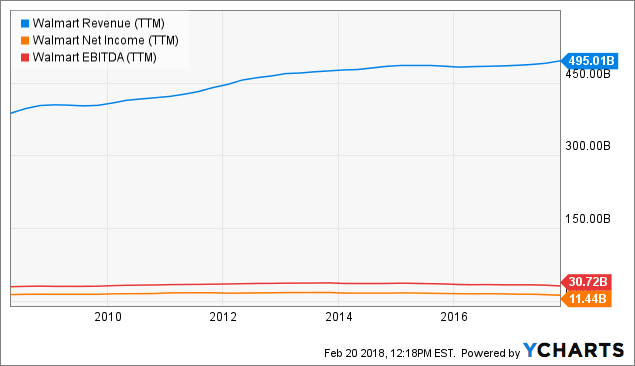
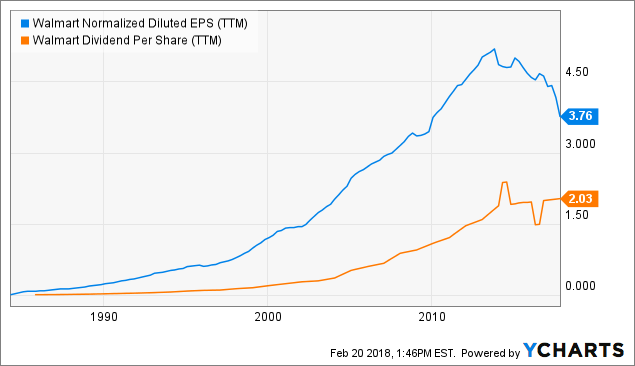
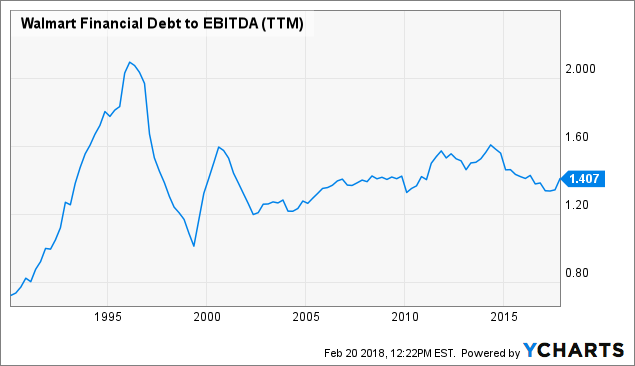
As a long-term investor in Walmart, I have seen many ups and downs of the stock in recent years. Today's sell-off will not change my attitude in this great company. The reason why I'm long in Walmart is its deep value and roots to the US economy. Remember, Walmart has over USD 485 billion in annual sales. The next biggest competitor (Costco Wholesale) generated sales of USD 129 billion and Amazon USD 177 billion. Walmart is a Dividend Champion with solid growing financials and 44 years of consecutive rising dividends. The current hike is very small, only 2% and may reflect the increasing pressure from decreasing earnings. For sure, Walmart doesn't grow at a high rate and got pressure from online retailers like Amazon, but it doesn't mean that they will be killed by them. And Wal-Mart still has room to grow dividends or run them flat until they have developed their own online sales tool to boost earnings. WMT Revenue (TTM) data by YChartsWMT Normalized Diluted EPS (TTM) data by YChartsA Look at the debt in relation to Walmart's EBITDA gives us a feeling of the financial stability. The ratio is often used to evaluate the leverage of a company. The figure amounted to 1.4 for Walmart; a very solid number. WMT Financial Debt to EBITDA (TTM) data by YChartsWalmart's management released a fiscal year 2019 EPS guidance between $4.75 and $5 per share. Analysts estimated a slightly lower value. The consensus estimate was $5.13. A main trigger for today's sell-off was the drop in online sales. The company reported e-commerce sales of 23%, compared to 50% in Q3 and 29% a year earlier. But its growth should come back to 40% this year.
Comparable sales - a key figure for retailer
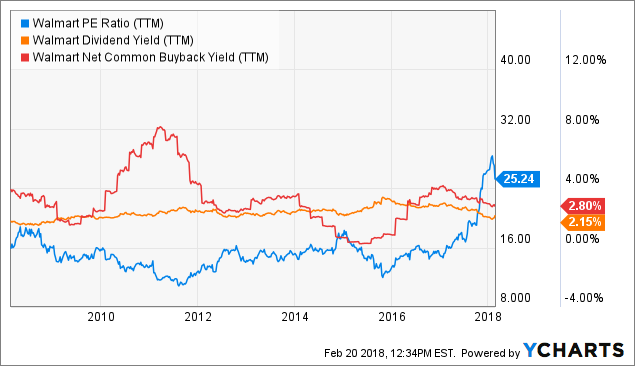
Comparable sales could develop into bigger problems for an inflexible business model with high fix costs. If you have a big cost basis and your customer traffic slows; your earnings are in free fall. Comparable sales for Q4 grew by 2.6%. Not bad in my view, especially when you consider that this was the 14th consecutive increase in the US market. So, what's the reason for the deep sell-off today? In my view, there are three reasons: - A high valuation which is not supported with higher growth - Slowing and not accelerating online sales - The expansion into e-commerce cost money and creates losses. Let's take a small look at the current valuations from Walmart: WMT PE Ratio (TTM) data by YChartsI guess, the recent stock price increase from around 70 bucks to around USD 100 in 2017 (new all-time highs), was driven by hopes that Walmart has a concept against Amazon and could develop its own business into a fast growing multi-channel-retail machine. Those hopes got trashed with the Q4 report. But does it mean that Walmart could not develop a wonderful online retail business over the next years? Definitly not! The current sell-off is hard for an investor, especially when you bought the stock over USD 100. An EPS in 2019 of 5 dollar would mean that your initial investment has a P/E of 20. For a slow growing stock like Walmart, who increased sales over the past 10 years by roughly 30%, is this ratio too high, especially when you consider that earnings run flat.
Conclusion
The capital market participants are very short-term orientated and focused on popular investment themes. For the retail industry means this: Go long online and short offline. The big money is betting that online will kill offline retail. I don't think that this will happen. I believe the future is a mix of both, a kind of multi-channel. Amazon bought Whole Foods as a result of this idea. Without physical stores, you will not be a future player in retail. Today's figures showing not a big growth but they are not as bad as the sell-off suggests. If investors think the valuation is too high, they should take a few chips off the table but Walmart is still a solid pick in the retail industry with a nice buyback and dividend yield close to 5% combined.
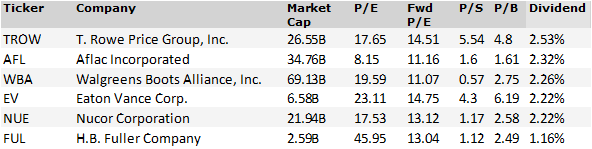
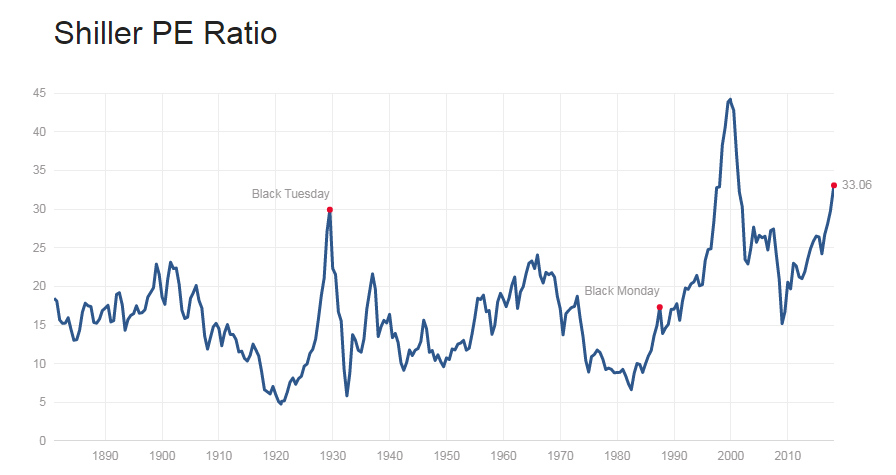
In this article, I am trying to research cheap dividend growth stocks with a very long history of dividend hikes. These are my screening criteria: - Consecutive dividend growth over 25 years (Dividend Champion) - Low forward P/E of less than 15 - Expected EPS growth for the next five years over 10% I’m a big fan of cheap dividend growth stocks. I deeply believe that those assets could give investors a solid return with a safety blanket. Six stocks fulfilled the above mentioned criteria. Here are the screening results: Source: Own Research; Finviz.com For sure, there are not many stocks on the screen, only six. The massive stock market rally pushed asset prices and stock valuations to above normal levels. If you look at the Shiller P/E for example, the ratio shows that the average stock on the market has a P/E of 33.06. See the table below: Source: www.multpl.com The good thing is, if you look steady for stock opportunities, you will ever find some. The current screen generated three financial stocks of which two come from the asset management industry and one from the life insurance industry: T. Rowe Price (NASDAQ:TROW) and Eaton Vance Corp. (NYSE:EV) are the two asset managers and Aflac (NYSE:AFL) the life insurer. In addition, two basic material stocks are on the list, Nucor Corp. (NYSE: NUE) and H.B. Fuller (NYSE:FUL). Finally, the drug retailer Walgreens is also part of the screen due to high growth and low forward P/E multiples. Now let’s have a closer look at each stock.
T. Rowe Price
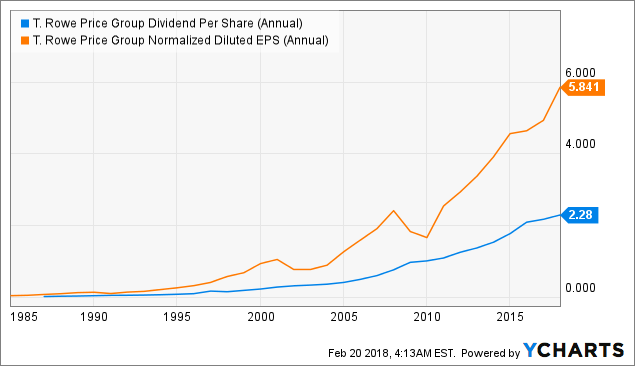
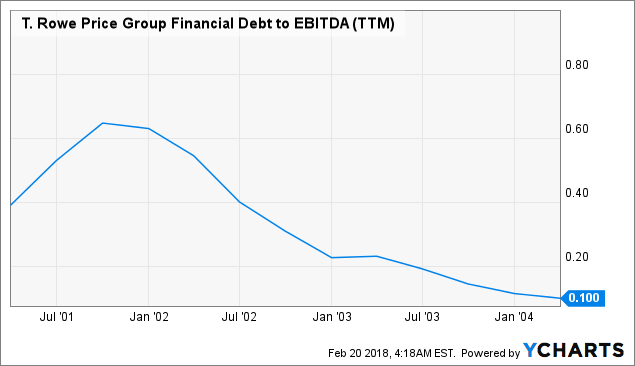
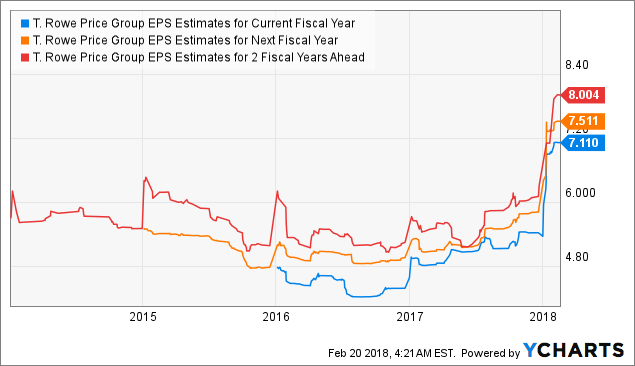
Source: Finviz.com Business Model: T. Rowe Price Group is a financial services holding company, which engages in the provision of investment advisory services. It provides an array of company sponsored U.S. mutual funds, other sponsored pooled investment vehicles, subadvisory services, separate account management, recordkeeping, and related services to individuals, advisors, institutions, financial intermediaries, and retirement plan sponsors. Nearly 87% of TROW's sales are related to the Investment Advisory Business. Sales of T. Rowe amounted to USD 4.8 billion in 2017 while net income reached a value of USD 1.5 billion. TROW Revenue (Annual) data by YChartsLong-Term growth of dividends and earnings T. Rowe Price is a good and well known Dividend Champion. The company managed to raise dividends over 32 consecutive years. The 10-year dividend growth rate amounted to 12.9%. That's a good number. Last week, TROW announced to hike its dividend by 23% to USD 70 cents per share; a massive hike that affirms the good running business. TROW Dividend Per Share (Annual) data by YChartsT. Rowe has a significant gap between earnings and dividend payments. This gives investors room to speculate on further rising dividends, especially when you look at the free cash flow situation, debt situation and growth forecasts. TROW Financial Debt to EBITDA (TTM) data by YChartsGrowth Perspectives The asset management industry facing pressure from passive managed fund operators like Blackrock (NYSE:BLK) who reported more and more incoming assets. There is a clear shift from active managed to passive managed. Despite the headwinds, TROW could announce a record amount of assets under management of USD 1.05 trillion as of January 2018. The reason for this development could be the good financial market who climbed from record to record in recent years. However, analysts ramped up its EPS revisions for 2018. Now they expect EPS at USD 7.11 for 2018 and USD 7.51 for 2019. TROW EPS Estimates for Current Fiscal Year data by YCharts
Aflac
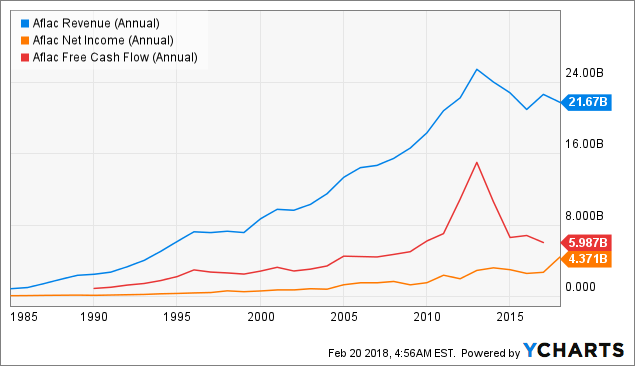
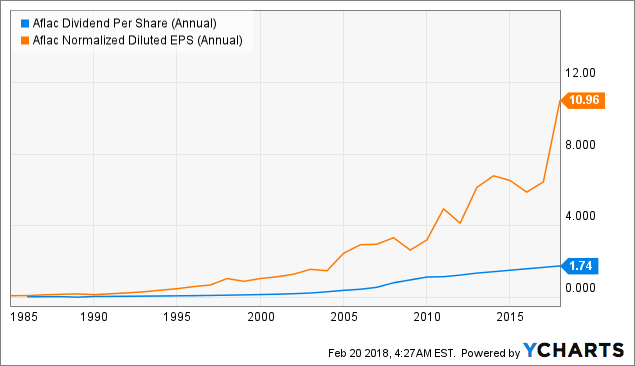
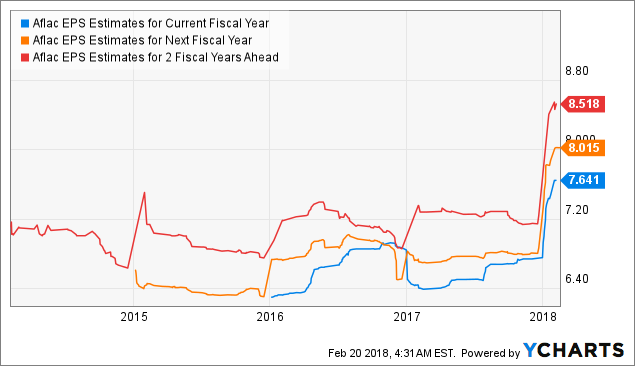
Source: Finviz.com The Aflac Company operates through the Aflac Japan and Aflac United States segments. The Aflac Japan segment offers life insurance, death benefits, and cash surrender values. The Aflac U.S. segment sells voluntary supplemental insurance products for people who already have major medical or primary insurance coverage. Sales of Aflac amounted to USD 21.67 billion while net income reached a value of USD 4.4 billion. The free cash is significant higher than the annual income. AFL Revenue (Annual) data by YChartsThe past performance of AFL looks good but the insurer faces headwinds since 2012. There may be two reasons: Shrinking Japanese population and low interest rates. Aflac is one of my top picks if you like to put money in this area. Long-Term growth of dividends and earnings Aflac increased dividends over 36 consecutive years. The long-term dividend growth rate (10-year average) stood at 8.1%. The latest dividend hike of 15.5% is much higher than the past value. This indicates a gaining momentum for the stock. AFL Dividend Per Share (Annual) data by YChartsGrowth Perspectives Most of Aflac's sales come from its Japan health and life insurance businesses. The company depends heavily on the Japanese economy and therefore on the foreign insurance industry. But it owns a deeply integrated business and works in a conservative industry with a strong brand. With rising interest rates, it could be easier for the insurer to generate more returns on its pension products. AFL EPS Estimates for Current Fiscal Year data by YChartsHowever, earnings are estimated at USD 7.6 for 2018 and USD 8.0 for 2019. There is still room to grow dividends if you look at the free cash flow and the gap between earnings and paid dividends.
Walgreens
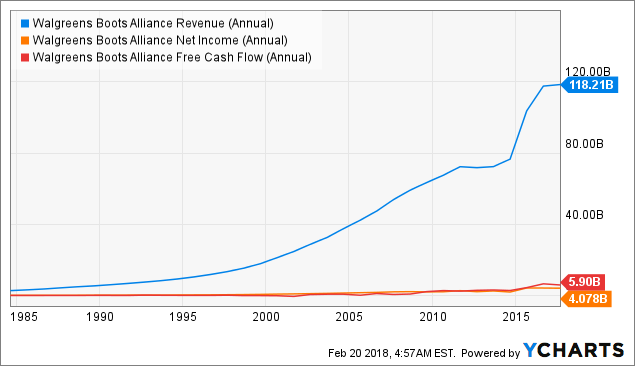
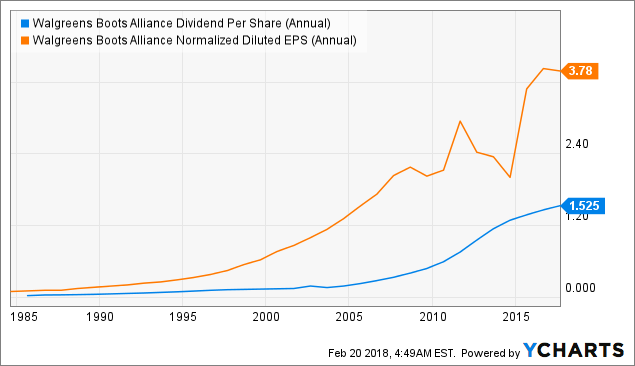
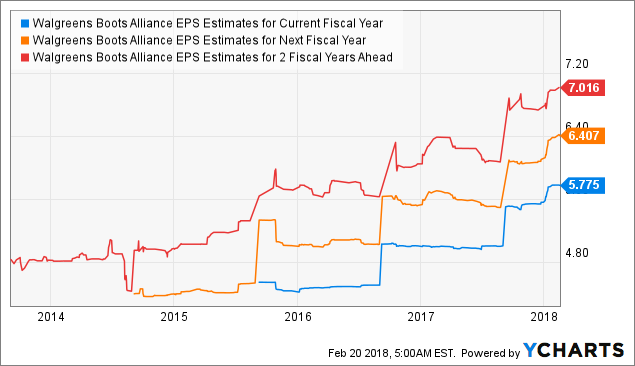
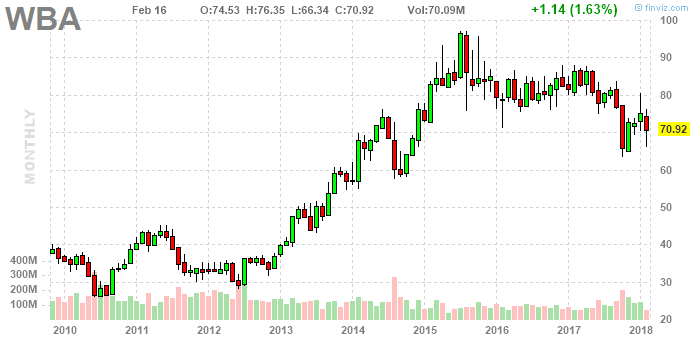
Source: Finviz.com Walgreens Boots Alliance engages in providing drug store services. The company operates through the following segments: Retail Pharmacy USA, Retail Pharmacy International, and Pharmaceutical Wholesale. Around 74% of sales come from the Retail Pharmacy USA business. The company generated sales of USD 118.2 billion in 2017. Net income amounted to USD 4.08 billion in the same period. WBA Revenue (Annual) data by YChartsLong-Term growth of dividends and earnings If you look at the data per share, you see a constant long-term rising in earnings, book value and dividends. WBA increased dividend payments over 41 consecutive years. The 10-year dividend grows at 16.2%. The latest dividend hike of just 6.6% is much lower than the past performance. There is pressure in the in the industry to consolidate. You see a lot of mergers in this space. For example, Walgreen tried to merge with Ride Aid and recently announced a step to acquire Boots Alliance. But it is not easy to grow in a very consolidated industry. WBA Dividend Per Share (Annual) data by YChartsGrowth Perspectives Growth perspectives are great for Walgreens. Earnings are expected to rise to USD 5.78 this year and USD 6.04 in 2019. Walgreen is the dominant player in the drug retail industry, together with CVS Health (NYSE:CVS). The reason why the stock price doesn't reflect the good fundamental development could be the fear of a market entry from Amazon. The online giant often announced to enter the drug retail space but has not delivered a detailed concept for this. WBA EPS Estimates for Current Fiscal Year data by YCharts
Eaton Vance
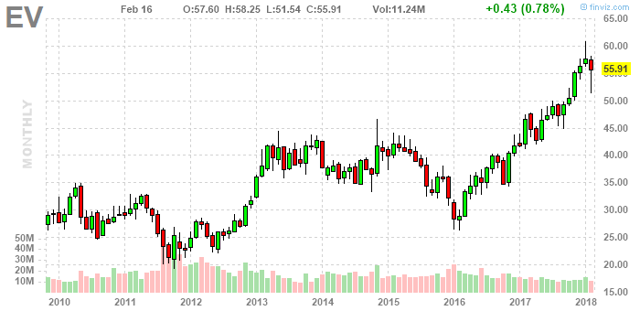
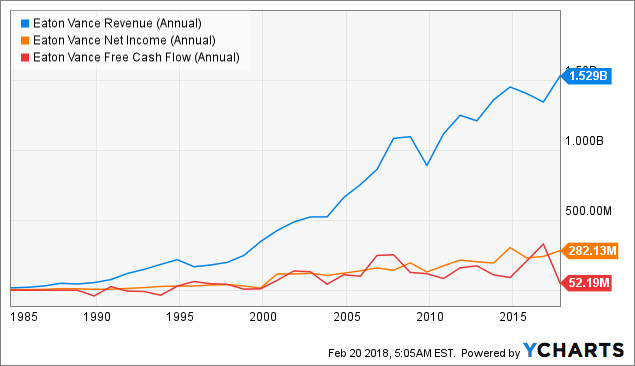
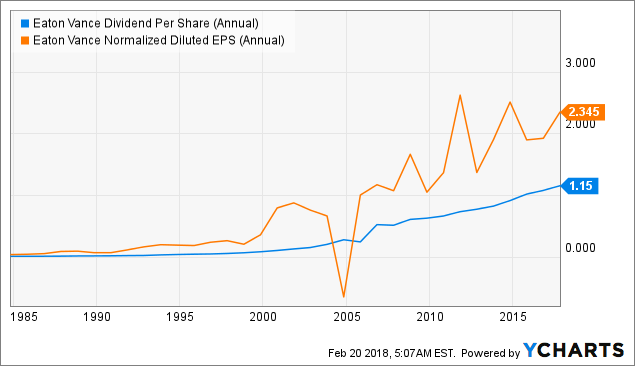
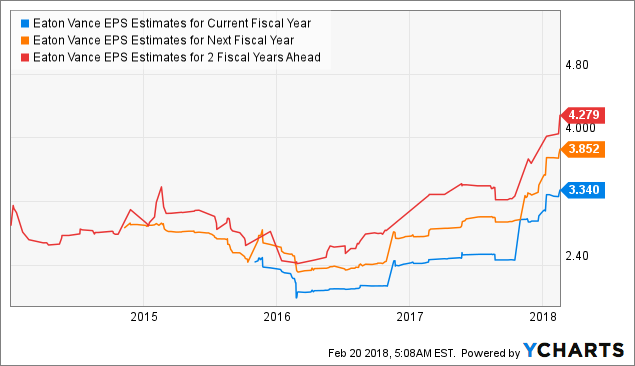
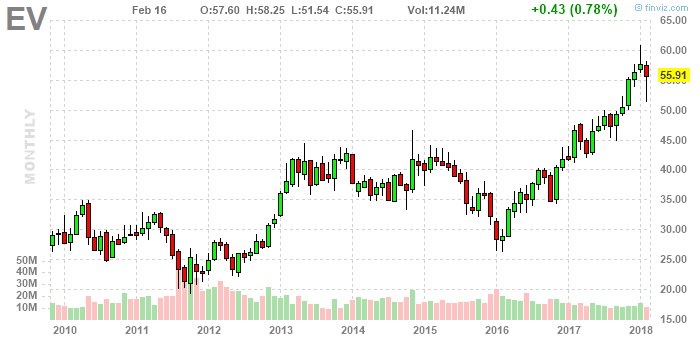
Source: Finviz.com Eaton Vance through its subsidiaries, engages in the creation, marketing, and management of investment funds. It offers a range of engineered portfolio implementation services, including tax-managed core and specialty index strategies, futures and options-based portfolio overlays, and centralized portfolio management of multi-manager portfolios. In 2017, Eaton Vance generated sales of USD 1.53 billion. The net income was USD 282 million. EV Revenue (Annual) data by YChartsLong-Term growth of dividends and earnings Eaton Vance increased its dividend payments over 37 consecutive years. The average growth rate over the past 10-years was 8.5%. The latest dividend hike of 10.7% was above past values. There is also room for further dividend hikes if you look at the gap between dividend payments and earnings. EV Dividend Per Share (Annual) data by YChartsGrowth Perspectives The industry perspectives are the same as for T. Rowe Price. I believe that TROW may be the better selection due to a better diversification and broader business. Eaton is also a smaller competitor with a market cap of just USD 6.6 billion compared to TROW's USD 26.8 billion. It is very important to be big in this industry. EV EPS Estimates for Current Fiscal Year data by YChartsIf you look at the earnings estimates for the next fiscal years, you have also a solid basis for further dividend growth.
Nucor Corporation
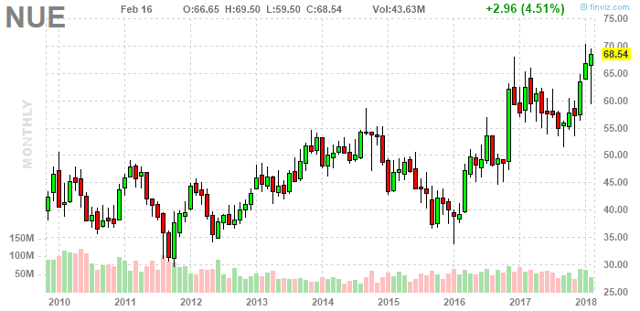
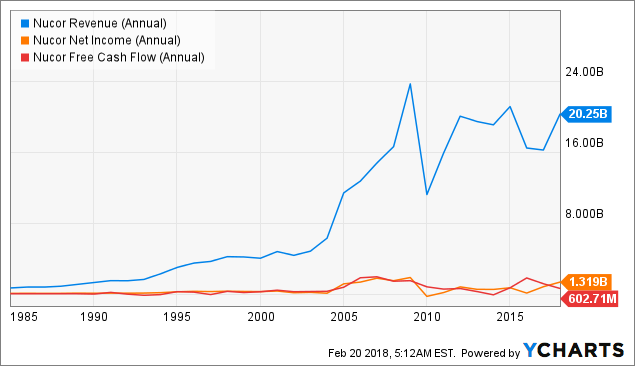
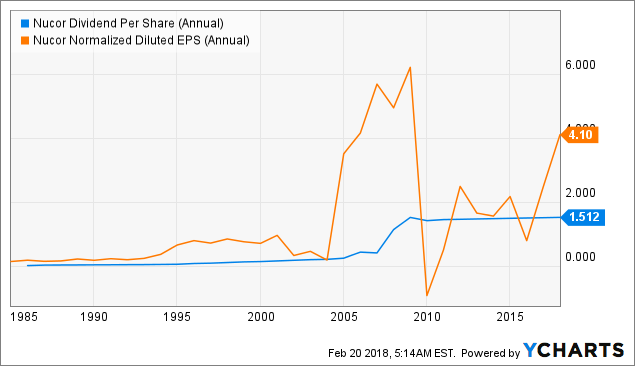
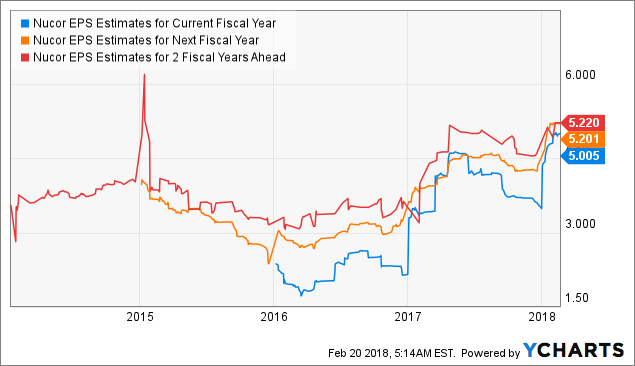
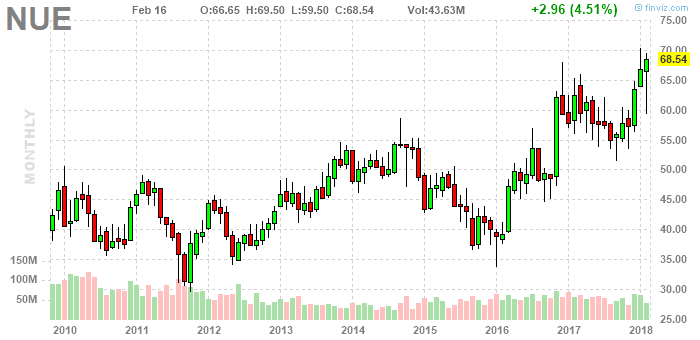
Source: Finviz.com Nucor Corp. engages in the manufacturing of steel and steel products. It operates through the following segments: Steel Mills, Steel Products, and Raw Materials. Most of its revenues come from Steel Mills. In 2017, sales of USD 20.3 billion were generated. The net income stood at USD 1.3 billion. NUE Revenue (Annual) data by YChartsThe steel industry is a hard business with massive price pressure and cycles. If you bet at the right time, you can earn much money but if you are wrong, you will get a big hit. Long-Term growth of dividends and earnings The steel producer increased dividends over 45 consecutive years at 9.1% 10-year average growth rates. The latest dividend hike was a micro hike with 0.66%. This was more a step to remain a Dividend Champion than to give shareholders a significant part of the earnings. NUE Dividend Per Share (Annual) data by YChartsGrowth Perspectives Nucor is a very cyclical stock. If you look at the earnings, you see how volatile the income ratio is. The dividend rate is nearly flat line that is crossed by earnings periodically. NUE EPS Estimates for Current Fiscal Year data by YChartsFor the next years, the earnings estimates are looking good and they are high enough to pay the current dividend of USD 1.51 per share but you may not expect a high EPS growth for the next years.
H.B. Fuller Corporation
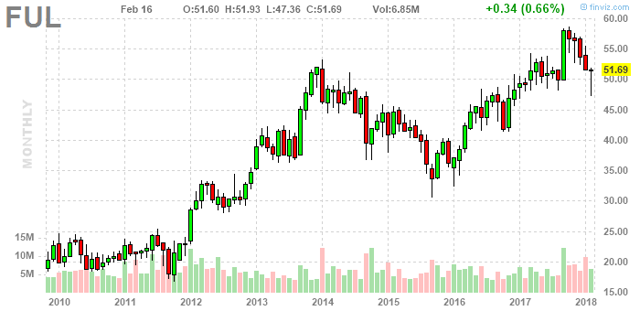
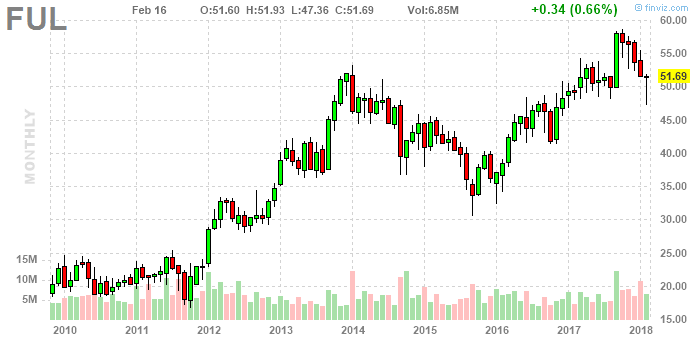
Source: Finviz.com H.B. Fuller engages in the formulation, manufacture, and market of adhesives, sealants, and other specialty chemical products. It operates through the following segments: Americas Adhesives, EIMEA, Asia Pacific, Construction Products, and Engineering Adhesives. FUL generated sales of USD 2.3 billion in 2017 and a net income of just USD 58 million.
Business Segment in USD (in Million)
2015
Share
2016
Share
Change
Americas Adhesives
806
37.80%
889
38.50%
10.23%
Europe, India, Middle East and Africa
545.14
25.60%
548.44
23.80%
0.61%
Construction Products
256.35
12.00%
238.51
10.30%
-6.96%
Engineering Adhesives
245.24
11.50%
289.31
12.50%
17.97%
Asia Pacific
241.83
11.30%
264.19
11.50%
9.25%
Royal Adhesives
-
-
77.03
3.30%
-
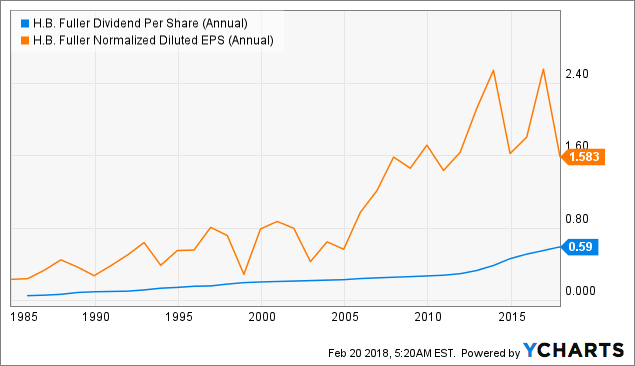
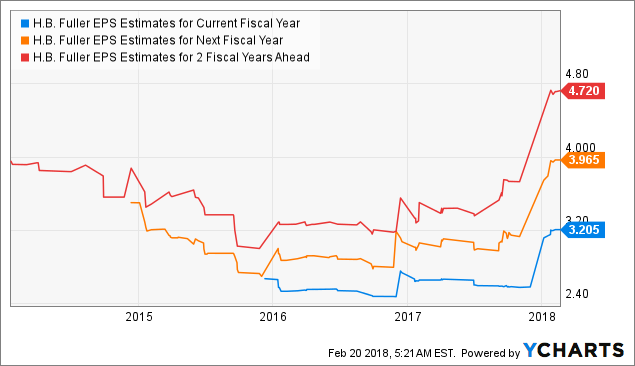
Source: 4-traders.com If you look at the sales and product share contributions, you will find out that Fuller is well diversified in its operations. But H.B. Fuller operates a cyclical business and offering low margins. In 2017, they worked with a gross margin of 26.2%. FUL Revenue (Annual) data by YChartsLong-Term growth of dividends and earnings H.B. Fuller increased dividends over 48 consecutive years. The 10-year dividend growth rate stood at 8.7%. Despite the cyclic business, FUL has done a great job to manage constant rising dividend payments. The latest dividend hike of 7.1% was nearly in line with the past long-term dividend growth rate. FUL Dividend Per Share (Annual) data by YCharts Growth Perspectives H.B. Fuller bought Royal Adhesives in 2017 and boosted its Q4 revenue by 18%. Despite the integration potential, analysts predict sales of USD 3 billion in 2018 and earnings of USD 158 million. For the current fiscal year, an EPS of USD 3.21 is estimated. Next year, the earnings prediction rises to nearly USD 4 per share. Compared to its current dividend payments of USD 60 Cents per share, there is enough room to grow its dividend. FUL EPS Estimates for Current Fiscal Year data by YCharts
Conclusion
The high market valuations advise investors to stay away from stocks. In general, it is wise not to buy stocks for long-term considerations but if you buy at reasonable prices, you still can make money on the market. The article shows that some of the "cheaper stocks" with the longest dividend growth history have tough times but they increase dividends at the lowest rates in their history. Others do better, boosting their dividend payments and ramp up share buybacks. It's a question of the financial flexibility and strategy how much the management could give investors back.
In this environment, I personally like T. Rowe Price and Aflac. Each of the stocks has a short-term backwind with rising interest rates. But you need to look at the yield curve to find the right exit point.
If you're attempting to build a portfolio that generates market-beating returns, your success typically will hinge on your ability to find stocks trading at good prices relative to the growth the underlying businesses can deliver. With that in mind, here are 3 companies that has a low valuation now compared to its earnings-growth potential. The results are Yirendai (NYSE: YRD), Criteo S.A. (NASDAQ: CRTO), and Changyou.com (NASDAQ: CYOU) as strong contenders trading at attractive discounts.

 Source: www.multpl.com
 Source: Finviz.com
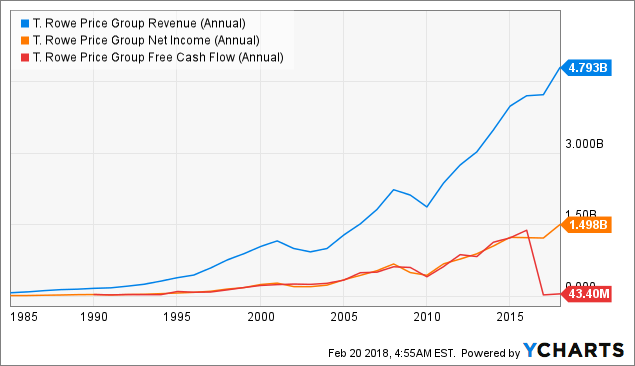


 Source: Finviz.com
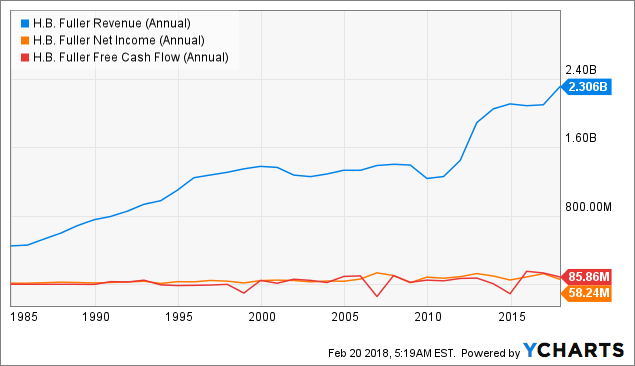
 Source: www.multpl.com
 Source: Finviz.com
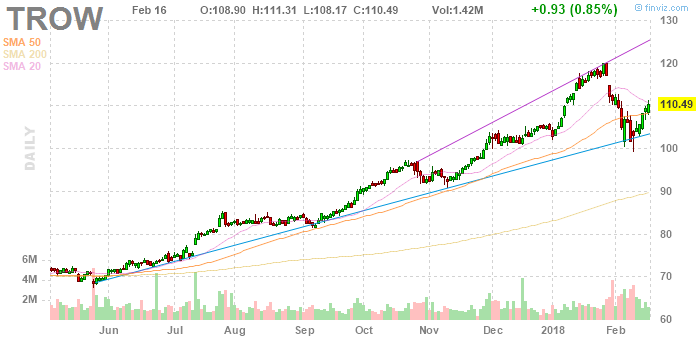
 Source: Finviz.com