
Below is a list of Dividend Champions With Very High EPS Growth Expectations...
This is only a small part of the full Dividend Yield Investor Fact Book Package you can get for a small donation.
The full package contains excel sheets of essential financial ratios from all 113 Dividend Champions (over 25 years of constant dividend growth) and 204 Dividend Contenders (10 to 24 years of consecutive dividend growth). It's an open version, so you can work with it very easily.
In addition, you get also a Foreign Yield Factbook with content tables of the highest yielding stocks from the most important economies in the world.
| Ticker | Company | Market Cap | P/E | Fwd P/E | P/S | P/B | Dividend | EPS next 5Y |
| PNR | Pentair plc | 7.65B | 13.86 | 16.5 | 1.52 | 1.63 | 1.63% | 64.00% |
| CVX | Chevron Corporation | 238.58B | 29.11 | 14.52 | 1.71 | 1.57 | 3.61% | 48.01% |
| MCY | Mercury General Corporation | 2.46B | 37.98 | 14.61 | 0.73 | 1.44 | 5.70% | 34.80% |
| MDP | Meredith Corporation | 2.38B | 385.31 | 9.43 | 1.25 | 2.18 | 3.96% | 27.20% |
| FUL | H.B. Fuller Company | 2.84B | 39.34 | 14.16 | 1.03 | 2.51 | 1.10% | 22.96% |
| EV | Eaton Vance Corp. | 6.32B | 18.61 | 14.51 | 3.87 | 5.67 | 2.32% | 19.30% |
| MSA | MSA Safety Incorporated | 3.72B | 60 | 20.03 | 2.96 | 5.93 | 1.55% | 18.00% |
| XOM | Exxon Mobil Corporation | 353.09B | 24.51 | 15.12 | 1.46 | 1.88 | 3.97% | 17.95% |
| LOW | Lowe's Companies, Inc. | 81.10B | 21.33 | 16.06 | 1.17 | 14.12 | 1.95% | 17.50% |
| CTAS | Cintas Corporation | 20.36B | 30.52 | 27.62 | 3.25 | 7.18 | 0.83% | 16.55% |
| ABM | ABM Industries Incorporated | 2.05B | 30.47 | 14.18 | 0.34 | 1.43 | 2.25% | 16.00% |
| PH | Parker-Hannifin Corporation | 21.09B | 17.58 | 13.75 | 1.51 | 3.59 | 1.92% | 15.85% |
| EMR | Emerson Electric Co. | 44.43B | 25.92 | 19.4 | 2.69 | 5.23 | 2.76% | 15.80% |
| SHW | The Sherwin-Williams | 38.11B | 32.4 | 18.89 | 2.35 | 10.48 | 0.83% | 15.33% |
| TNC | Tennant Company | 1.40B | 430.05 | 26.41 | 1.29 | 4.58 | 1.07% | 15.00% |
| CSL | Carlisle Companies | 6.99B | 23.88 | 16.28 | 1.66 | 2.57 | 1.31% | 15.00% |
| GRC | The Gorman-Rupp | 919.43M | 29.64 | 23.19 | 2.4 | 2.8 | 1.40% | 15.00% |
| SPGI | S&P Global Inc. | 53.19B | 31.2 | 22.28 | 8.61 | 7025 | 0.95% | 14.97% |
| BMI | Badger Meter, Inc. | 1.32B | 39.18 | 27.91 | 3.26 | 4.74 | 1.13% | 14.90% |
| UMBF | UMB Financial Corporation | 3.83B | 19.13 | 15.45 | 5.99 | 1.76 | 1.50% | 14.70% |
This is only a small part of the full Dividend Yield Investor Fact Book Package you can get for a small donation.
The full package contains excel sheets of essential financial ratios from all 113 Dividend Champions (over 25 years of constant dividend growth) and 204 Dividend Contenders (10 to 24 years of consecutive dividend growth). It's an open version, so you can work with it very easily.
In addition, you get also a Foreign Yield Factbook with content tables of the highest yielding stocks from the most important economies in the world.
For a small donation, we send you every update from the Fact Books direct to your donation e-mail adress.

A donation from you can helps us to develop this books and improve the quality of the work. Together we can make the world a better and smarter place. A place with no information advantage between poor and rich persons who have enough budget to buy the expensive data from Reuters and Bloomberg.
A donation from you can helps us to develop this books and improve the quality of the work. Together we can make the world a better and smarter place. A place with no information advantage between poor and rich persons who have enough budget to buy the expensive data from Reuters and Bloomberg.
The Dividend Yield Fact Book compilation contains the following books and one Excel Sheet with financial ratios form all Dividend Champions and Dividend Contenders. Here is what you get for your donation:
Monthly updated Factbooks and Excelsheets
- Foreign Yield Fact Book - 42 Pages PDF
- Dividend Growth Stock Fact Book - 32 Pages PDF
- Dividend Growth Stock Fact Book - 32 Pages PDF
- Dividend Growth Excel Sheet With over 300 Dividend Champions and Dividend Contenders
You'll get all these PDF's and Excels updated every month via e-mail. It's a one donation-lifetime service, as long as we can create it. These books need much time to create and we make them unsalaried, only for little donations.

These books and Excel Sheets are frequently updated and keeps you up-to date with current yield figures from the best Dividend Growth Stocks. Here is a preview of the content:


The Dividend Yield Factbooks could help you to find the right investments in order to generate a better return with less risk – It’s a simple database about the best dividend growth stocks for long-term investors.
Your benefits…
- A great overview about market price ratios of stocks
- Compilation of the longest dividend raisers
- Easy to compare stocks
- Find the best stocks fast
- Generate better returns
- Reduce your portfolio risk
- Generate stable growing dividend income long-term
There is no donation minimum or limit. You can choose the donation amount you want to give. The more you support us, the more we can create and give back to you. We think this is a fair deal.
Every donation, even a tiny one, helps us to keep this blog free available for everyone. Help us to support people with no income or big budget to get free and easy information on the web. Thank you.

Here is what some users say:


#1 Get an overview about the best yielding stocks of the world with the Foreign Yield Database for a special country
Check out more details here: Foreign Yield Factbook and Excelsheet.
Here is a preview of Canada:


#2 Receive Corporate Factbooks from Dividend Champions to stay up-to-date
See more details here: Corporate Factbooks
Example from Altria:
#3 - Get Factbook Compilations around interesting investing themes like Dogs of the Dow
Find more details here: Factbook compilation around investment themes
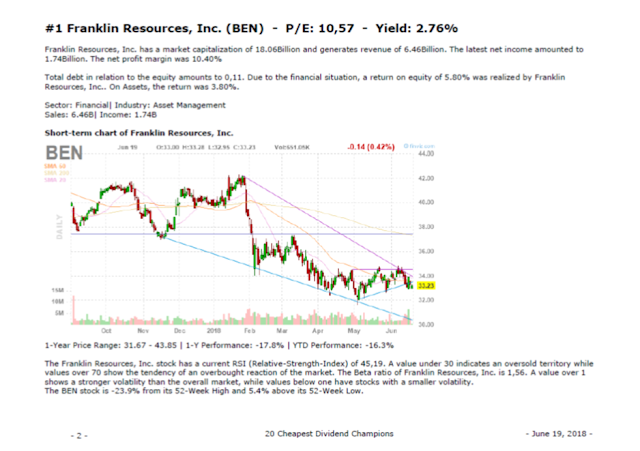
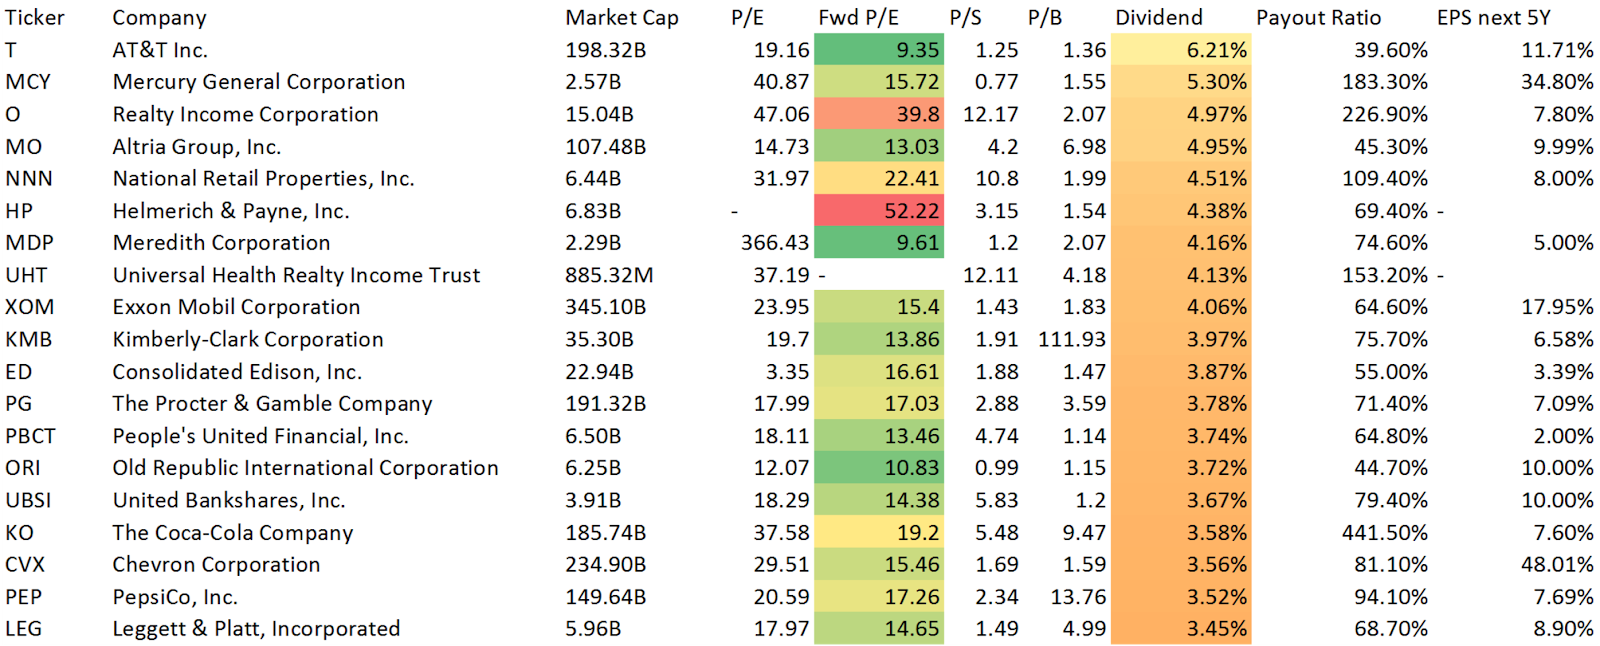
Here is a preview of the 20 Cheapest Dividend Champions:


You'll get all these PDF's and Excels updated every month via e-mail. It's a one donation-lifetime service, as long as we can create it. These books need much time to create and we make them unsalaried, only for little donations.

These books and Excel Sheets are frequently updated and keeps you up-to date with current yield figures from the best Dividend Growth Stocks. Here is a preview of the content:


The Dividend Yield Factbooks could help you to find the right investments in order to generate a better return with less risk – It’s a simple database about the best dividend growth stocks for long-term investors.
Your benefits…
- A great overview about market price ratios of stocks
- Compilation of the longest dividend raisers
- Easy to compare stocks
- Find the best stocks fast
- Generate better returns
- Reduce your portfolio risk
- Generate stable growing dividend income long-term
Every donation, even a tiny one, helps us to keep this blog free available for everyone. Help us to support people with no income or big budget to get free and easy information on the web. Thank you.
Here is what some users say:
"As an experienced
professional financial consultant for over 20 years, there isn't much I haven't already seen. This e-book and
Excel tool is an absolute must have!
If you’re looking
to improve your personal portfolio returns and you want a quick overview of the best dividend grower on the market, I would definitely recommend those
Dividend Yield Factbooks.
They introduce, with a clear and simple database, a large
number of the best dividend growth stocks worldwide.
If you look for dividend
stocks abroad? No problem, you get a large and easy overview with the Foreign Yield Factbook. Try
to find similar worksheets on the web. There is no alternative!
All I can say is, study
these e-books, discover the excel sheet and you'll walk away as a much better
educated and more informed person. I will be looking for
more dividend information tools like this and I will be sharing this
information with my fellow colleagues."
Carl Holst – Financial Consultant

"As a dividend growth investor, I’m a big believer in stocks with a long dividend growth history and it worked for me over the past 30 years.
This excellent
ebooks and excel tools cover all essential aspects for private and
institutional investors. I use these tools often to sharpen my view on the
markets."
"I discovered the
market for years as an analyst and know that dividend growth stocks are the top
investments on the market. They offer less risks because of their ability to
pay and grow dividends. The price you pay for this is simple: They have a limited ability to become the next
tenbagger or game changer company. If you look for high growth technology stocks or want to make money with Penny stocks or binary options, you should take other sources for your research.
I’ve analyzed many value stocks in my career
and most of them were dividend growers like constituents from the yield fact
books. These lists compile a big number of high quality stocks. If you have
less time, it’s the perfect tool to stay up to date."
Robert Escable – Senior Analyst

“As a market professional, I need to be active
to justify my work to clients. The stock market goes up and down and these
Factbooks and Excelsheets help me to find the right stocks in very market
situation.”
Jane Lulowsi – Portfolio Manager

----Bonus for your donation----
Special Reports if released:
#1 Get an overview about the best yielding stocks of the world with the Foreign Yield Database for a special country
Check out more details here: Foreign Yield Factbook and Excelsheet.
Here is a preview of Canada:

#2 Receive Corporate Factbooks from Dividend Champions to stay up-to-date
See more details here: Corporate Factbooks
Example from Altria:
#3 - Get Factbook Compilations around interesting investing themes like Dogs of the Dow
Find more details here: Factbook compilation around investment themes
Here is a preview of the 20 Cheapest Dividend Champions:
You get all this stuff for a small donation. There is no minimum or limit to donate. You can choose how much you like to support us. The more you give, the more we can give back to you. That's a fair deal in our view.

Thank you very much for your help. Thank YOU, it's a great pleasure!!!


