Bookmark and Share
Showing posts with label DE. Show all posts

#Agribusiness Stocks - #Bunge #Ingredion #Deere #DowDuPont #Potash

Find below a list of Agribusiness Stocks. The agribusiness portfolio includes stocks engaged in activities related to growing crops, processing grains, and producing food.


Ticker Company Market Cap P/E P/S P/B Dividend Get the PDF…
BG Bunge Limited 9.62B 111.4 0.21 1.5 2.93% Security Analysis of BG
ADM Archer-Daniels-Midland Company 26.66B 24.31 0.43 1.42 2.83% Security Analysis of ADM
INGR Ingredion Incorporated 7.20B 13.12 1.23 2.37 2.41% Security Analysis of INGR
DWDP DowDuPont Inc. 157.67B 114.2 2.23 1.56 2.23% Security Analysis of DWDP
DE Deere & Company 44.98B 17.17 1.34 4.3 2.00% Security Analysis of DE
ANDE The Andersons, Inc. 986.84M - 0.28 1.21 1.92% Security Analysis of ANDE
FMC FMC Corporation 12.00B 27.15 3.43 4.02 0.74% Security Analysis of FMC
AVD American Vanguard Corporation 688.29M 34.84 1.77 1.98 0.38% Security Analysis of AVD
IPI Intrepid Potash, Inc. 533.60M - 3.28 1.3 - Security Analysis of IPI
SEED Origin Agritech Limited 217.25M - - 1.23 - Security Analysis of SEED

This list is only a small part of the full Dividend Yield Investor Fact Book Collection you can get for a small donation.


The full package contains excel sheets with essential financial ratios from all 113 Dividend Champions (over 25 years of constant dividend growth) and 204 Dividend Contenders (10 to 24 years of consecutive dividend growth). It's an open version, so you can work with it very easily and do your own research.

In addition, you will also get a copy of the Foreign Yield Factbook and the World Index Yield Factbook with content tables of the highest yielding stocks from the most important economies/indices in the world.


Help us by giving to our work here. When you make a little donation, you will instantly receive our latest Dividend Yield Factbook Package as a thank you gift.


A donation from you can helps us to develop this books and improve the quality of the work. Together we can make the world a better and smarter place. A place with no information advantage between poor and rich persons who have enough budget to buy the expensive data from Reuters and Bloomberg.

The Dividend Yield Fact Book compilation contains the following books and one Excel File with financial ratios from all Dividend Champions and Dividend Contenders. Here is what you get for your donation:

Monthly updated Factbooks and Excelsheets

- Foreign Yield Fact Book - 42 Pages PDF
- World Index Yield Fact Book - 35 Pages PDF
- Dividend Growth Stock Fact Book - 32 Pages PDF 
- Dividend Growth Excel Sheet of Dividend Champions and Dividend Contenders


These books and Excel Sheets are frequently updated and keeps you up-to date with current yield figures from the best Dividend Growth Stocks. Here is a preview of the content:


There is no donation minimum or limit. You can choose the donation amount you want to give. The more you support us, the more we can create and give back to you. We think this is a fair deal.


Donate to the our Factbooks because investor education and learning can’t wait.
A small donation will help us to create in distribute more and more high-quality content for investors and students. 

Every donation, even a tiny one, helps us to keep this blog free available for everyone. Help us to support people with no income or big budget to get free and easy information on the web. Thank you.


----Bonus for your donation----


Special Reports if released:


#1 Get an overview about the best yielding stocks of the world with the Foreign Yield Database for a special country

Check out more details here: Foreign Yield Factbook and Excelsheet.

Here is a preview of Canada:


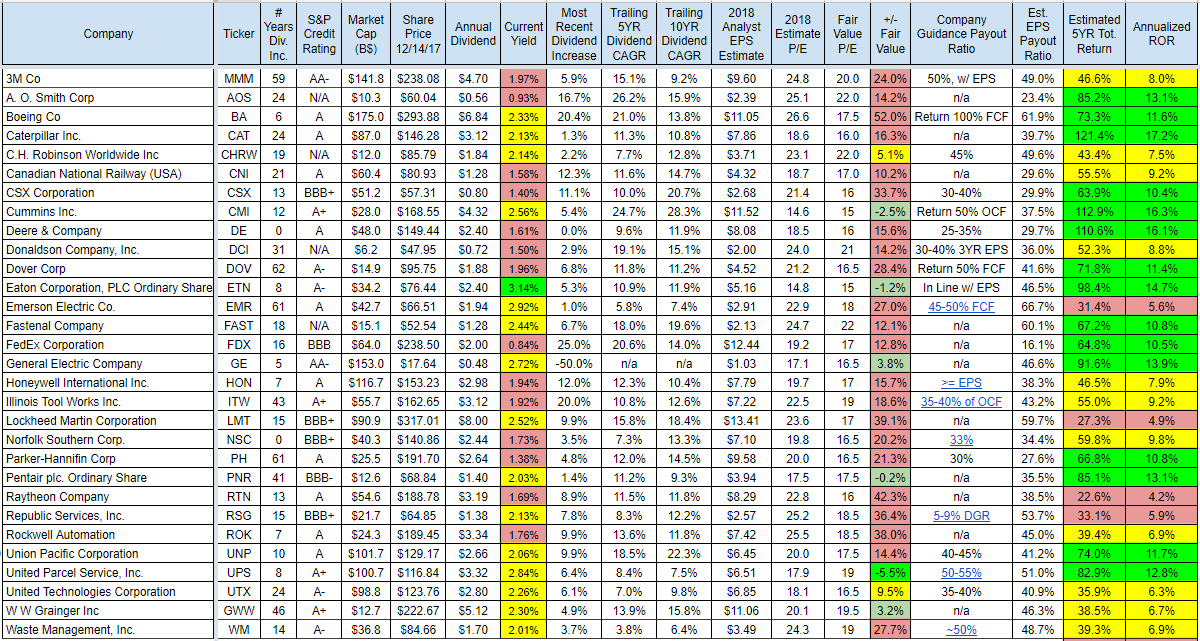
#2 Receive Corporate Factbooks from Dividend Champions to stay up-to-date


See more details here: Corporate Factbooks


#3 - Get Factbook Compilations around interesting investing themes like Dogs of the Dow


Find more details here: Factbook compilation around investment themes 

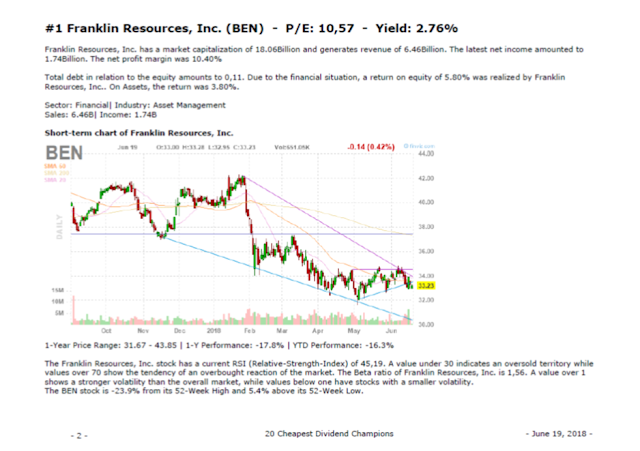
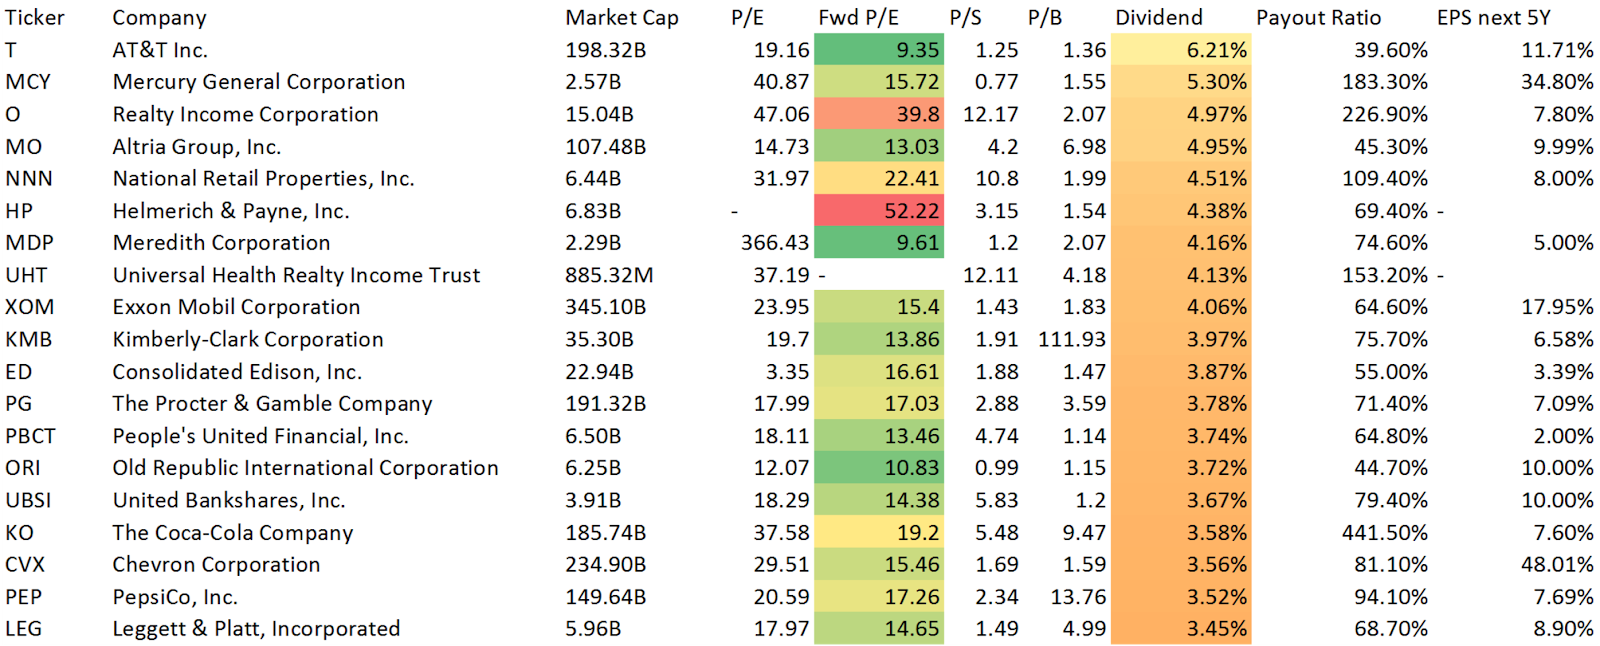
Here is a preview of the 20 Cheapest Dividend Champions:


You get all this stuff for a small donation. There is no minimum or limit to donate. You can choose how much you like to support us. The more you give, the more we can give back to you. That's a fair deal in our view.


Thank you very much for your help. Thank YOU, it's a great pleasure!!!

An Overview Of The Best Industrial Dividend Income Stocks Q4/2017

The companies on this list were originally selected based on their track records of dividend growth, financial ratings, and earnings growth.

With the industrials being cyclical in nature, I've found that this sector is one of the more difficult ones to forecast, both in putting valuations on companies and in predicting future dividend growth.

The following table contains historical dividend growth information as well as current dividend rate, dividend yield, analyst earnings expectations, and the corresponding PE ratio and payout ratio from these numbers.


Warren Buffett Buys And Sells These Stocks Surprisingly

Warren Buffett and his team of portfolio managers listed some 148 positions worth a whopping $147.9 billion in equities in the official Form 13F filing with the Securities and Exchange Commission. This compared to $128.8 billion as of the end of the third quarter of 2016 and $115.46 billion as of December 31.

It is important to understand that some changes are made by Warren Buffett himself, with 14 sub-entities of Berkshire Hathaway in prior filings. Other changes may have come from the likes of newer portfolio managers Ted Weschler and Todd Combs. It appears as though the Buffett portfolio managers have been given much larger investing amounts.

If there is one key takeaway for the 2017 stocks it would be that this was one of the largest changes we have seen in years. New stakes were added and other stakes were grown. Other stakes were cleaned out or decreased.

Attached you will find a small overview of Warren Buffett's latest stock buys and sells during Q4 in 2016...

Warren Buffett's Buys And Sells Surprisingly These Dividend Stocks

When it comes to dividends, Warren Buffett won't dish them out -- but he will take them.

Buffett has for years maintained a strict no-dividends policy at Berkshire Hathaway (BRK.A) (BRK.B). The conglomerate has paid only one dividend during his tenure, in 1967, and he has joked that he "must have been in the bathroom" when the decision was made.

"The question is about evaluating Berkshire when it doesn't pay any dividends," the billionaire said in a 1998 lecture at the University of Florida Business School. "And it won't pay dividends, either. That's a promise I can keep. All you get with Berkshire stock is that you can stick it in your safe deposit box, and every year you take it out and fondle it."

While Buffett won't distribute dividends to Berkshire Hathaway shareholders, he has no qualms about collecting them from others. Most of the companies in his investment portfolio make regular dividend payments.

Attached you will find a list of Warren Buffett's latest stock holding buys and sells. Airlines are a major buy on Warren Buffett's shopping list.

For sure, financials, energy and media stocks are also long investment for the investment guru Warren Buffett. 

Take a look at Warren Buffett's latest investment buys and sells.

Here are the latest trades...

7 Buffett Backed Dividend Stocks To Bet On

Warren Buffett has 19 dividend stocks with a 2.0% or better yield in his portfolio, but which are the best? I've used a systematic approach to find the seven best -- and rank them, from "worst" to best.

Warren Buffett's investment style is a culmination of value, growth, and quality.

He looks for:

- Great business (quality)
- Trading at fair or better prices (value)
- That will compound his money far into the future (growth)

This approach leads Buffet to invest primarily in dividend stocks. Dividend stocks make up around 92% of Buffett's portfolio.

His top four holdings have an average position weighted dividend yield of 3.2% and make up 63% of his portfolio. High quality dividend growth stocks are the cornerstone of Buffett's portfolio.

Attached you will find 7 of his best dividend bets you should consider for the next years. Each of the results is a high quality stock with room to grow in the future.

Here are the results...

18 Industrial Stocks I Love To Buy

I am personally finding plenty of interesting bargains and reasonable valuations in the industrial sector these days, one of the few places they exist.

Dividend investors might be tired of investing in the same old consumer staples or consider those trades too crowded to invest new money into. So where do they go?

 Below I have outlined a few interesting industrial plays that have very cheap or reasonable valuations and competitive yields or future dividend growth prospects if the current yield is very low.

Here are the top yielding results...

These 20 Dividend Stocks Are The Highest-Yielding Holdings In Warren Buffett's Berkshire Hathaway Portfolio

If you're looking for dividends from the Oracle of Omaha, you won't find them at Berkshire Hathaway -- but you will uncover them in a number of his top stocks. 

Recently, I showed you the best performing stocks from the big oracle of Omaha, Warren Buffett.

Today, we pulled 20 highest dividend-paying stocks from Buffett's Berkshire Hathaway portfolio, according to the firm's most recent 13F filing, which reflects holdings as of March 31, 2016. 

Each comprises has a dividend yield of 1.76% or higher. The highest yielding stocks has a current yield of 5.07 percent and earnings of him should grow by 14.07% over the next five years.

These 20 dividend stocks are some of the highest-yielding holdings in Warren Buffett's Berkshire Hathaway portfolio....

Warren Buffett's 20 Best Performing Stocks Year-To-Date

Warren Buffett is among the best investors in stock market history, and millions of people follow his picks closely to try to find ideas for their own portfolios.

Even though the overall stock market hasn't made much headway so far in 2016, the Oracle of Omaha has managed to include some solid year-to-date performers within his own holdings, as Buffett recently reported to the SEC on Form 13-F.

In particular, four of Buffett's stocks have given investors strong double-digit returns in 2016, and shareholders want to know if the Buffett magic will continue.

Let's take a look at these 20 best performing top stocks from the Buffett Portfolio Year-to-date...

Warren Buffett Adds Surprisingly These 6 Dividend Stocks To His Portfolio

Warren Buffett is one of the most respected investors in the whole world. What he buys and sells let money follow to his ideas.

Warren Buffett’s Berkshire Hathaway Inc. disclosed a stake in Apple Inc., betting that the technology company will rebound after a slump driven by a slowdown in iPhone sales.

Berkshire held 9.81 million Apple shares as of March 31, according to a regulatory filing Monday from the billionaire’s Omaha, Nebraska-based company.

The holding was valued at $1.07 billion at the end of the first quarter. Attached you will the all dividend stock buys from the past quarter, made by Buffett. Apple was definitely the biggest move he made within the latest quarter.

The Apple stock is not a typical investment for the old-school investor but Warren said that the iPhone maker developed more to a consumer company than a technology stocks. He might be right if you look at the consumer focused products the company is making and the big i-store sales.

These are Warren Buffett's latest dividend stock buys from the past quarter...

Warren Buffett's Best 10 Dividend Stocks Everybody Should Also Own

Warren Buffett, one of the most legendary investors of all time, is a great source for finding high-yield dividend stocks.

Armed with a simple strategy of buying high quality businesses at reasonable prices with an intention of holding them forever, Buffett has racked up one of the best long-term performance track records.

Buffett's Berkshire Hathaway owned over 40 stocks at the end of 2015, and the majority of them pay dividends.

More impressively, nine of Buffett's top 10 positions pay a dividend, and nearly a quarter of his stocks have a high dividend yield of about 3% or more.

We took a closer look at Buffett's top 10 stock picks for dividends which are also ideal investments for conservative retiree dividend portfolios.

Let's take a look at some of the best dividend stocks that Berkshire Hathaway likes so much.

These are Warren Buffett's top stocks sorted by yield...

10 Best Stocks To Start Your Dividend Growth Strategy

Dividend investing can add significantly to returns over a lifetime, so beginner investors are right to want to own some dividend-paying stocks in their portfolios.

A company that pays consistent, rising dividends is likely a financially healthy firm that generates consistent cash flow (this cash, after all, is where the dividends come from). 

These companies are often stable, and their stock prices tend to be less volatile than the market in general. As such, they may be lower risk than companies that do not pay dividends and that have more volatile price movements.

Because many dividend-paying stocks are lower risk, the stocks are an appealing investment for both younger people looking for a way to generate income over the long haul, and for people approaching retirement - or who are in retirement - who desire a source of retirement income.

Let's say you're looking for a few things: high-quality, solid dividend cash flow and a reasonable valuation. To meet those tests, you could think about something like this:

- Rated A++ in financial strength,
- 3%+ dividend yield and
- P/E ratio under 15.

Now to be sure this is limited, and it may not be exactly what you're after. Yet it does give you a starting point. When I use those metrics, I go from thousands of securities down to less than a dozen:

Here are the results...

Warren Buffett's 8 Latest Strategic Stock Movements In Detail

In its latest regulatory filing, Warren Buffett's Berkshire Hathaway didn't report too many big surprises, but there were a few notable moves. 

Specifically, it appears that Buffett is betting on a rebound in energy and commodity prices, and is harvesting some of his gains elsewhere.


Attached, at the end of this article, you will find a detailed view on his latest buys and sells.


Dividend stocks are in main focus and you will find a detailed introduction of Warren's latest dividend stock buys and sells of the quarter.

Here are the dividend stocks Warren Buffett bought and sold out during Q4/2015...

Warren Buffett's Latest Portfolio Transactions

Warren Buffett is a great investor and his trade decisions are very important for investors who believe on his further success.

I also cover the activities of Warren Buffett. Today I will show you the latest portfolio movements from the oracle of Omaha.

Warren was lazy during the latest quarter. He bought only five stocks and reduced four stakes.

Wells Fargo, Deere, Axalta, Libertay Media and finally Kinder Morgan are the latest buys. Attached you will also find a list of stocks from his asset allocation.

Here is Warren Buffett's current portfolio...

Warren Buffett's 20 Best Yielding Dividend Stocks Now

Most investors know Warren Buffett looks for quality, but few know the degree to which he invests in dividend stocks. 

Warren is one of the most respected investors in the world. 

I did a great job and generated an unbelievable return over decades.

Here are some key essentials of his current investment strategy:

- 92.5% of Warren Buffett’s portfolio is invested in dividend stocks 


- His top 9 holdings have an average dividend yield of 3.0% 

- Many of these dividend stocks have paid rising dividends over decades 

Warren Buffett prefers to invest in shareholder friendly businesses with long track records of success. 


It happens that dividend stocks with long histories of dividend increases match what Warren Buffett looks for in a stock investment.

Attached you will find a compilation of Warren Buffett's 20 best yielding stocks. The list contains all of his highest yielding stocks with the most important fundamentals.


Here are Warren Buffett's 5 top yielding dividend stocks....

These Dividend Growth Stocks Could Reduce Its Dividends In The Future

With interest rates now having spent years near their all-time lows, many investors who might prefer safer assets have moved to dividend stocks as a way to generate income from their investments. 

The problem with this strategy is that it only works if the companies that have been mailing out those dividend checks can afford to keep doing so.

Therefore, income investors should probably avoid putting their money into any company that is currently experiencing a financial hardship that might threaten its ability to continue making dividend payments.

I started my research by screening the Dividend Champions list by stocks with unsustainable dividend measures. High payouts, high debt, low growth and a cyclic business model are key drivers for an unsustainable dividend.

Each of the attached results grown its dividend over 10 consecutive years.

Here are the results from my research, sorted by highest debt load...

10 Undervalued Companies For Income Investors

There are a number of great companies in the market today. I've selected the highest dividend yields among the undervalued companies for defensive dividend stock investors.

The companies selected for this list may not pay what some consider to be a huge dividend, but they have demonstrated strong financial positions through passing the rigorous requirements and show potential for capital growth based on their current price in relation to intrinsic value.


As such, these defensive dividend stocks may be a great investment if they prove to be suitable for your portfolio after your own additional research.


Dividend paying stocks have been a better investment than non-dividend paying stocks over the past 40 years. Investing in dividend stocks is not the only strategy that has a long history of outperformance. Value investing has also significantly outperformed the market over long periods.


Stocks with the lowest 10% of price-to-book ratios have outperformed stocks with the highest 10% of price-to-book ratios substantially from 1926 through 2013 (an 87-year study). 

Combining dividend paying stocks with value investing will likely generate strong returns going forward. This article highlights 10 dividend paying stocks that appear to be undervalued at this time. Many of these stocks are facing headwinds at this time; this is why they are likely undervalued. 


Here are the results...


CMI Corporation -- Yield: 4.45%

CMI Corporation (NYSE:CMI) employs 54,600 people, generates revenue of $19,221.00 million and has a net income of $1,736.00 million. The current market capitalization stands at $15.56 billion.

CMI Corporation’s earnings before interest, taxes, depreciation and amortization (EBITDA) amounts to $2,393.00 million. The EBITDA margin is 12.45% (the operating margin is 12.30% and the net profit margin 9.03%).

Financials: The total debt represents 10.76% of CMI Corporation assets and the total debt in relation to the equity amounts to 21.91%. Due to the financial situation, a return on equity of 21.64% was realized by CMI Corporation.

Twelve trailing months earnings per share reached a value of $9.34. Last fiscal year, CMI Corporation paid $2.81 in the form of dividends to shareholders.

Market Valuation: Here are the price ratios of the company: The P/E ratio is 9.37, the P/S ratio is 0.81 and the P/B ratio is finally 2.06. The dividend yield amounts to 4.45%.

Stock Charts:


Long-Term Stock Price Chart of CMI Corporation (CMI)
Long-Term Dividend Payment History of CMI Corporation (CMI)
Long-Term Dividend Yield History of CMI Corporation (CMI)


QUALCOMM -- Yield: 4.05%

QUALCOMM (NASDAQ:QCOM) employs 33,000 people, generates revenue of $25,281.00 million and has a net income of $5,268.00 million. The current market capitalization stands at $71.34 billion.

QUALCOMM’s earnings before interest, taxes, depreciation and amortization (EBITDA) amounts to $7,350.00 million. The EBITDA margin is 29.07% (the operating margin is 22.12% and the net profit margin 20.84%).

Financials: The total debt represents 21.59% of QUALCOMM assets and the total debt in relation to the equity amounts to 34.91%. Due to the financial situation, a return on equity of 14.93% was realized by QUALCOMM.

Twelve trailing months earnings per share reached a value of $3.20. Last fiscal year, QUALCOMM paid $1.80 in the form of dividends to shareholders.

Market Valuation: Here are the price ratios of the company: The P/E ratio is 14.82, the P/S ratio is 2.82 and the P/B ratio is finally 2.30. The dividend yield amounts to 4.05%.

Stock Charts:


Long-Term Stock Price Chart of QUALCOMM (QCOM)
Long-Term Dividend Payment History of QUALCOMM (QCOM)
Long-Term Dividend Yield History of QUALCOMM (QCOM)


CA -- Yield: 3.68%

CA (NASDAQ:CA) employs 11,600 people, generates revenue of $4,262.00 million and has a net income of $810.00 million. The current market capitalization stands at $11.91 billion.

CA’s earnings before interest, taxes, depreciation and amortization (EBITDA) amounts to $1,582.00 million. The EBITDA margin is 37.12% (the operating margin is 27.26% and the net profit margin 19.01%).

Financials: The total debt represents 11.50% of CA assets and the total debt in relation to the equity amounts to 22.45%. Due to the financial situation, a return on equity of 14.33% was realized by CA.

Twelve trailing months earnings per share reached a value of $1.68. Last fiscal year, CA paid $1.00 in the form of dividends to shareholders.

Market Valuation: Here are the price ratios of the company: The P/E ratio is 16.20, the P/S ratio is 2.79 and the P/B ratio is finally 2.10. The dividend yield amounts to 3.68%.

Stock Charts:


Long-Term Stock Price Chart of CA (CA)
Long-Term Dividend Payment History of CA (CA)
Long-Term Dividend Yield History of CA (CA)


Macerich -- Yield: 3.53%

Macerich (NYSE:MAC) employs 1,117 people, generates revenue of $1,105.25 million and has a net income of $1,606.93 million. The current market capitalization stands at $12.21 billion.

Macerich’s earnings before interest, taxes, depreciation and amortization (EBITDA) amounts to $597.04 million. The EBITDA margin is 54.02% (the operating margin is 4.97% and the net profit margin 145.39%).

Financials: The total debt represents 47.95% of Macerich assets and the total debt in relation to the equity amounts to 111.56%. Due to the financial situation, a return on equity of 33.28% was realized by Macerich.

Twelve trailing months earnings per share reached a value of $9.96. Last fiscal year, Macerich paid $2.51 in the form of dividends to shareholders.

Market Valuation: Here are the price ratios of the company: The P/E ratio is 7.74, the P/S ratio is 11.04 and the P/B ratio is finally 2.16. The dividend yield amounts to 3.53%.

Stock Charts:


Long-Term Stock Price Chart of Macerich (MAC)
Long-Term Dividend Payment History of Macerich (MAC)
Long-Term Dividend Yield History of Macerich (MAC)


Invesco -- Yield: 3.44%

Invesco (NYSE:IVZ) employs 6,430 people, generates revenue of $5,147.10 million and has a net income of $1,004.50 million. The current market capitalization stands at $13.32 billion.

Invesco’s earnings before interest, taxes, depreciation and amortization (EBITDA) amounts to $1,366.30 million. The EBITDA margin is 26.55% (the operating margin is 24.81% and the net profit margin 19.52%).

Financials: The total debt represents 32.93% of Invesco assets and the total debt in relation to the equity amounts to 80.94%. Due to the financial situation, a return on equity of 11.86% was realized by Invesco.

Twelve trailing months earnings per share reached a value of $2.40. Last fiscal year, Invesco paid $0.98 in the form of dividends to shareholders.

Market Valuation: Here are the price ratios of the company: The P/E ratio is 13.09, the P/S ratio is 2.59 and the P/B ratio is finally 1.59. The dividend yield amounts to 3.44%.

Stock Charts:


Long-Term Stock Price Chart of Invesco (IVZ)
Long-Term Dividend Payment History of Invesco (IVZ)
Long-Term Dividend Yield History of Invesco (IVZ)


WestRock -- Yield: 3.28%

WestRock (NYSE:WRK) employs 41,400 people, generates revenue of $11,381.30 million and has a net income of $511.80 million. The current market capitalization stands at $11.77 billion.

WestRock’s earnings before interest, taxes, depreciation and amortization (EBITDA) amounts to $1,758.60 million. The EBITDA margin is 15.45% (the operating margin is 7.70% and the net profit margin 4.50%).

Financials: The total debt represents 22.21% of WestRock assets and the total debt in relation to the equity amounts to 48.34%. Due to the financial situation, a return on equity of 6.35% was realized by WestRock.

Twelve trailing months earnings per share reached a value of $3.18. Last fiscal year, WestRock paid $1.20 in the form of dividends to shareholders.

Market Valuation: Here are the price ratios of the company: The P/E ratio is 14.40, the P/S ratio is 1.03 and the P/B ratio is finally 1.01. The dividend yield amounts to 3.28%.

Stock Charts:


Long-Term Stock Price Chart of WestRock (WRK)
Long-Term Dividend Payment History of WestRock (WRK)
Long-Term Dividend Yield History of WestRock (WRK)


Western Digital -- Yield: 3.22%

Western Digital (NASDAQ:WDC) employs 76,449 people, generates revenue of $14,572.00 million and has a net income of $1,465.00 million. The current market capitalization stands at $14.38 billion.

Western Digital’s earnings before interest, taxes, depreciation and amortization (EBITDA) amounts to $2,916.00 million. The EBITDA margin is 20.01% (the operating margin is 11.06% and the net profit margin 10.05%).

Financials: The total debt represents 16.91% of Western Digital assets and the total debt in relation to the equity amounts to 27.84%. Due to the financial situation, a return on equity of 16.22% was realized by Western Digital.

Twelve trailing months earnings per share reached a value of $5.62. Last fiscal year, Western Digital paid $1.80 in the form of dividends to shareholders.

Market Valuation: Here are the price ratios of the company: The P/E ratio is 11.05, the P/S ratio is 0.99 and the P/B ratio is finally 1.55. The dividend yield amounts to 3.22%.

Stock Charts:


Long-Term Stock Price Chart of Western Digital (WDC)
Long-Term Dividend Payment History of Western Digital (WDC)
Long-Term Dividend Yield History of Western Digital (WDC)


Cisco Systems -- Yield: 3.21%

Cisco Systems (NASDAQ:CSCO) employs 71,833 people, generates revenue of $49,161.00 million and has a net income of $8,981.00 million. The current market capitalization stands at $132.79 billion.

Cisco Systems’s earnings before interest, taxes, depreciation and amortization (EBITDA) amounts to $13,696.00 million. The EBITDA margin is 27.86% (the operating margin is 21.91% and the net profit margin 18.27%).

Financials: The total debt represents 22.34% of Cisco Systems assets and the total debt in relation to the equity amounts to 42.47%. Due to the financial situation, a return on equity of 15.44% was realized by Cisco Systems.

Twelve trailing months earnings per share reached a value of $1.87. Last fiscal year, Cisco Systems paid $0.80 in the form of dividends to shareholders.

Market Valuation: Here are the price ratios of the company: The P/E ratio is 14.02, the P/S ratio is 2.70 and the P/B ratio is finally 2.23. The dividend yield amounts to 3.21%.

Stock Charts:


Long-Term Stock Price Chart of Cisco Systems (CSCO)
Long-Term Dividend Payment History of Cisco Systems (CSCO)
Long-Term Dividend Yield History of Cisco Systems (CSCO)


Deere & Company -- Yield: 3.11%

Deere & Company (NYSE:DE) employs 59,600 people, generates revenue of $28,862.80 million and has a net income of $1,940.00 million. The current market capitalization stands at $25.32 billion.

Deere & Company’s earnings before interest, taxes, depreciation and amortization (EBITDA) amounts to $4,842.50 million. The EBITDA margin is 16.78% (the operating margin is 11.99% and the net profit margin 6.72%).

Financials: The total debt represents 63.59% of Deere & Company assets and the total debt in relation to the equity amounts to 546.45%. Due to the financial situation, a return on equity of 24.55% was realized by Deere & Company.

Twelve trailing months earnings per share reached a value of $5.76. Last fiscal year, Deere & Company paid $2.40 in the form of dividends to shareholders.

Market Valuation: Here are the price ratios of the company: The P/E ratio is 13.39, the P/S ratio is 0.88 and the P/B ratio is finally 3.75. The dividend yield amounts to 3.11%.

Stock Charts:


Long-Term Stock Price Chart of Deere & Company (DE)
Long-Term Dividend Payment History of Deere & Company (DE)
Long-Term Dividend Yield History of Deere & Company (DE)


T. Rowe Price Group -- Yield: 2.94%

T. Rowe Price Group (NASDAQ:TROW) employs 5,908 people, generates revenue of $3,982.10 million and has a net income of $1,229.60 million. The current market capitalization stands at $17.78 billion.

T. Rowe Price Group’s earnings before interest, taxes, depreciation and amortization (EBITDA) amounts to $2,002.60 million. The EBITDA margin is 50.29% (the operating margin is 47.48% and the net profit margin 30.88%).

Financials: The total debt represents 0.00% of T. Rowe Price Group assets and the total debt in relation to the equity amounts to 0.00%. Due to the financial situation, a return on equity of 23.80% was realized by T. Rowe Price Group.

Twelve trailing months earnings per share reached a value of $4.51. Last fiscal year, T. Rowe Price Group paid $1.76 in the form of dividends to shareholders.

Market Valuation: Here are the price ratios of the company: The P/E ratio is 15.69, the P/S ratio is 4.46 and the P/B ratio is finally 3.43. The dividend yield amounts to 2.94%.

Stock Charts:


Long-Term Stock Price Chart of T. Rowe Price Group (TROW)
Long-Term Dividend Payment History of T. Rowe Price Group (TROW)
Long-Term Dividend Yield History of T. Rowe Price Group (TROW)