Showing posts with label VET. Show all posts
Showing posts with label VET. Show all posts
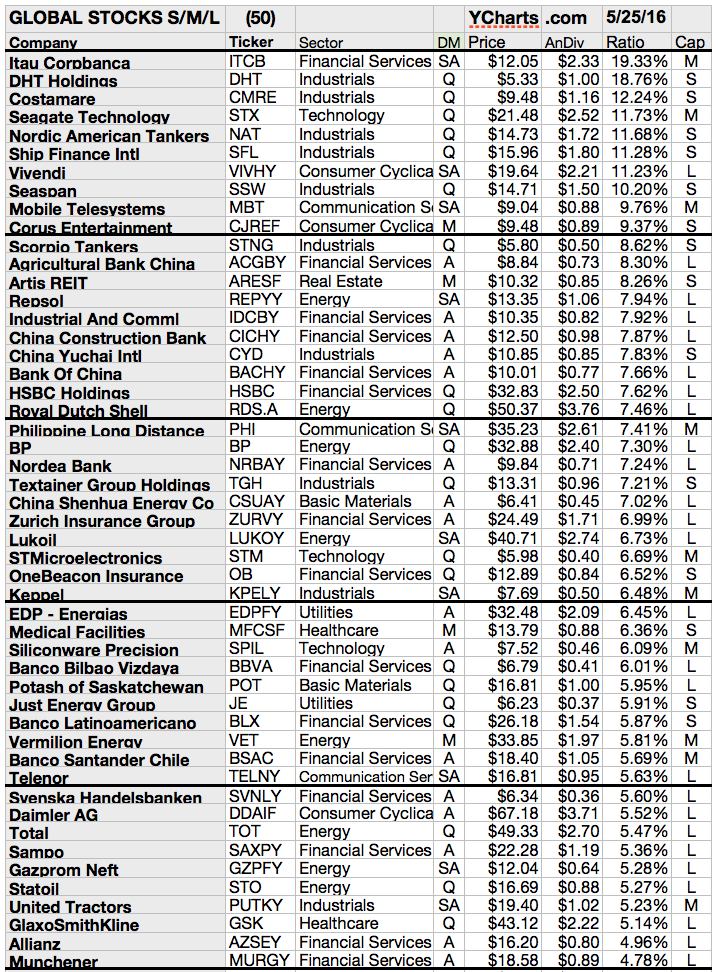
Global Dividend Dogs For May 2016
Please find attached the current list of the Dividends Dogs for May 2016. The list contain 50 stocks with yields between 4.78% and 19.33%.
What is a dividend dog?
The "dog" moniker is earned in three steps:
(1) any stock paying a reliable, repeating dividend
(2) whose price has fallen to a point where its yield (dividend/price)
(3) has grown higher than its peers (here in the Global collection) is tagged as a dividend dog.
 |
| Global Dividend Dogs For May 2016, Source: Seeking Alpha |
Ex-Dividend Stocks: Best Dividend Paying Shares On July 29, 2013
The best yielding and biggest
ex-dividend stocks researched by ”long-term-investments.blogspot.com”. Dividend Investors
should have a quiet overview of stocks with upcoming ex dividend dates.
The ex dividend date is the
final date on which the new stock buyer couldn’t receive the next dividend. If
you like to receive the dividend, you need to buy the stock before the ex dividend
date. I made a little screen of the best yielding stocks with a higher
capitalization that have their ex date on the next trading day.
A full list of all stocks
with payment dates can be found here: Ex-Dividend Stocks July 29,
2013. In total, 52 stocks go ex
dividend - of which 33 yield more than 3 percent. The average yield amounts to 5.07%.
Here is the sheet of the best yielding, higher
capitalized ex-dividend stocks:
Company
|
Ticker
|
Mcap
|
P/E
|
P/B
|
P/S
|
Yield
|
Prospect
Capital Corporation
|
2.50B
|
10.93
|
0.98
|
4.88
|
11.96%
|
|
Kinder
Morgan Energy Partners
|
32.05B
|
39.84
|
3.60
|
3.39
|
6.10%
|
|
Entertainment
Properties Trust
|
2.43B
|
21.00
|
1.67
|
7.40
|
6.09%
|
|
Baytex
Energy Corp.
|
5.19B
|
23.66
|
4.25
|
5.59
|
5.93%
|
|
El Paso Pipeline Partners, L.P.
|
9.49B
|
20.33
|
874.40
|
6.31
|
5.67%
|
|
Omega
Healthcare Investors
|
3.75B
|
27.48
|
3.39
|
10.20
|
5.53%
|
|
National
Retail Properties, Inc.
|
4.10B
|
34.37
|
1.90
|
11.81
|
4.38%
|
|
Enterprise
Products Partners LP
|
55.54B
|
22.50
|
4.00
|
1.30
|
4.32%
|
|
Brookfield
Office Properties CA
|
2.36B
|
-
|
2.74
|
4.47
|
4.31%
|
|
Vermilion
Energy Inc.
|
5.42B
|
29.60
|
3.63
|
5.16
|
4.26%
|
|
Kinder
Morgan, Inc.
|
40.27B
|
41.80
|
2.95
|
3.25
|
3.91%
|
|
Western
Gas Partners LP
|
6.41B
|
87.36
|
3.79
|
7.39
|
3.53%
|
|
Alliant
Energy Corporation
|
5.93B
|
16.52
|
1.88
|
1.86
|
3.51%
|
|
NiSource
Inc.
|
9.78B
|
22.14
|
1.72
|
1.88
|
3.18%
|
|
Texas
Instruments Inc.
|
43.45B
|
24.53
|
3.97
|
3.45
|
2.85%
|
|
ConAgra
Foods, Inc.
|
15.48B
|
19.95
|
2.94
|
1.00
|
2.71%
|
|
Susquehanna
Bancshares, Inc.
|
2.57B
|
16.21
|
0.97
|
3.57
|
2.32%
|
|
Eaton
Vance Corp.
|
4.80B
|
23.27
|
7.37
|
3.81
|
1.95%
|
|
East
West Bancorp, Inc.
|
4.30B
|
15.72
|
1.91
|
4.20
|
1.92%
|
|
Western Gas Equity Partners, LP
|
8.73B
|
137.59
|
12.79
|
10.22
|
1.80%
|
Ex-Dividend Stocks: Best Dividend Paying Shares On May 29, 2013
The best yielding and biggest
ex-dividend stocks researched by ”long-term-investments.blogspot.com”. Dividend Investors
should have a quiet overview of stocks with upcoming ex dividend dates.
The ex dividend date is the
final date on which the new stock buyer couldn’t receive the next dividend. If
you like to receive the dividend, you need to buy the stock before the ex dividend
date. I made a little screen of the best yielding stocks with a higher
capitalization that have their ex date on the next trading day.
A full list of all stocks
with payment dates can be found here: Ex-Dividend Stocks May 29,
2013. In total, 110 stocks and
preferred shares go ex dividend - of which 37 yield more than 3 percent. The
average yield amounts to 4.06%.
Here is the sheet of the best yielding, higher
capitalized ex-dividend stocks:
Company
|
Ticker
|
Mcap
|
P/E
|
P/B
|
P/S
|
Yield
|
Prospect
Capital Corporation
|
2.63B
|
10.70
|
1.01
|
5.13
|
12.21%
|
|
TransAlta
Corp.
|
3.89B
|
-
|
1.32
|
1.87
|
7.68%
|
|
Baytex
Energy Corp.
|
4.78B
|
21.54
|
3.85
|
5.11
|
6.68%
|
|
Entertainment
Properties Trust
|
2.66B
|
22.89
|
1.83
|
8.10
|
5.59%
|
|
Lorillard,
Inc.
|
16.58B
|
14.11
|
-
|
2.48
|
5.01%
|
|
Vermilion
Energy Inc.
|
5.13B
|
27.99
|
3.43
|
4.88
|
4.66%
|
|
Integrys
Energy Group, Inc.
|
4.69B
|
12.54
|
1.44
|
1.01
|
4.59%
|
|
Brookfield Infrastructure Partners
|
8.04B
|
85.07
|
1.53
|
4.01
|
4.49%
|
|
Barrick
Gold Corporation
|
19.18B
|
-
|
0.85
|
1.34
|
4.18%
|
|
Piedmont Office Realty Trust
|
3.37B
|
71.82
|
1.29
|
8.25
|
3.98%
|
|
Brookfield
Office Properties Canada
|
2.62B
|
-
|
3.04
|
4.95
|
3.89%
|
|
Bank
of Hawaii Corporation
|
2.30B
|
14.57
|
2.24
|
5.61
|
3.51%
|
|
Northeast
Utilities
|
13.48B
|
20.60
|
1.42
|
1.88
|
3.43%
|
|
Cullen/Frost
Bankers, Inc.
|
3.86B
|
17.11
|
1.58
|
6.09
|
3.11%
|
|
Brookfield
Properties Corporation
|
9.15B
|
8.55
|
0.79
|
3.88
|
3.09%
|
|
Perusahaan
Perseroan
|
25.07B
|
18.16
|
4.16
|
3.18
|
3.06%
|
|
Harris
Corp.
|
5.52B
|
10.79
|
3.29
|
1.06
|
2.94%
|
|
AVX
Corp.
|
2.03B
|
-
|
1.03
|
1.43
|
2.91%
|
|
Time
Warner Cable Inc.
|
27.65B
|
3.80
|
4.01
|
1.02
|
2.74%
|
|
Corning
Inc.
|
23.10B
|
13.27
|
1.08
|
2.92
|
2.55%
|
Subscribe to:
Comments (Atom)


