To keep this blog running free without ads, we need your help. For a small donation by using this link or clicking the paypal donation pic below, you can help us to keep this blog alive. As gift for your support, we send you our full Dividend Growth Stock Factbook Collection with over 800+ long-term dividend growth stocks in PDF and Excel. You can also join our distribution list for this life-time service for free. Thank you for supporting us.

| Ticker | Company | P/E | Fwd P/E | P/S | P/B | Dividend | Get the PDF via Mail… |
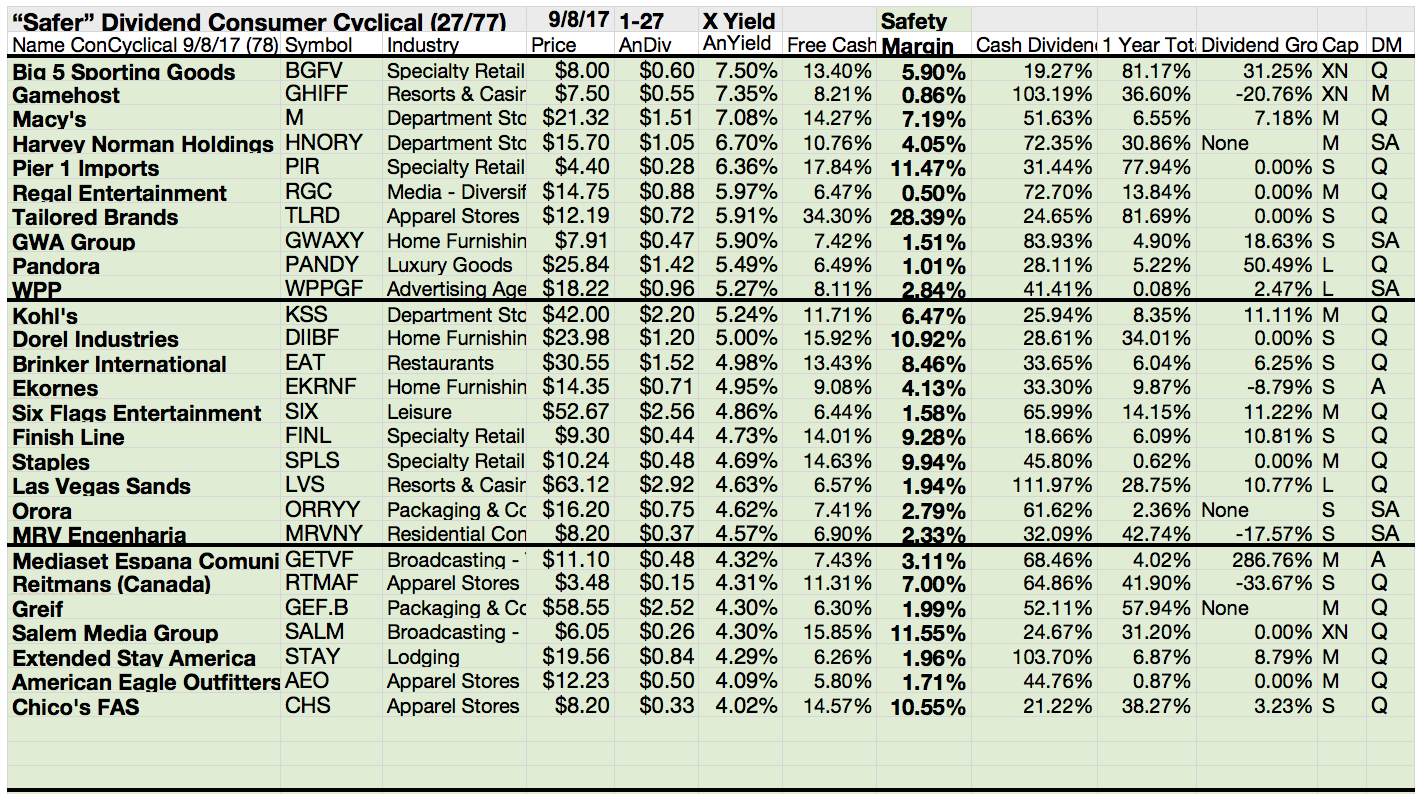
| SALM | Salem Media Group, Inc. | - | 12.38 | 0.39 | 0.45 | 6.67% | Stock Report of SALM |
| CATO | The Cato Corporation | 17.96 | 16.5 | 0.63 | 1.56 | 6.15% | Stock Report of CATO |
| OMI | Owens & Minor, Inc. | - | 11.18 | 0.12 | 1.35 | 5.72% | Stock Report of OMI |
| CHS | Chico's FAS, Inc. | 13.93 | 13.31 | 0.5 | 1.7 | 3.90% | Stock Report of CHS |
| HBAN | Huntington Bancshares Incorporated | 15.19 | 11.47 | 4.82 | 1.7 | 3.53% | Stock Report of HBAN |
| DTE | DTE Energy Company | 15.91 | 17.96 | 1.54 | 2.08 | 3.12% | Stock Report of DTE |
| MRK | Merck & Co., Inc. | 47.95 | 15.2 | 4.54 | 5.76 | 2.75% | Stock Report of MRK |
| SYBT | Stock Yards Bancorp, Inc. | 17.67 | 15.49 | 7.25 | 2.5 | 2.62% | Stock Report of SYBT |
| AIG | American International Group, Inc. | 304.19 | 9.66 | 0.97 | 0.77 | 2.45% | Stock Report of AIG |
| JEF | Jefferies Financial Group Inc. | 23.54 | 12.97 | 0.88 | 0.77 | 2.18% | Stock Report of JEF |
| NEU | NewMarket Corporation | 22.37 | 17.95 | 1.97 | 8.34 | 1.77% | Stock Report of NEU |
| AIMC | Altra Industrial Motion Corp. | 24.51 | 12.31 | 1.23 | 2.71 | 1.76% | Stock Report of AIMC |
| PFLT | PennantPark Floating Rate Capital Ltd. | 14.54 | 11.24 | 7.52 | 0.96 | 1.65% | Stock Report of PFLT |
| FFIN | First Financial Bankshares, Inc. | 31.4 | 26.01 | 15.35 | 4.17 | 1.38% | Stock Report of FFIN |
| APH | Amphenol Corporation | 25.36 | 24.11 | 3.77 | 7.65 | 0.96% | Stock Report of APH |
| ALLE | Allegion plc | 25.44 | 18.4 | 3.35 | 16.84 | 0.94% | Stock Report of ALLE |
| FCNCA | First Citizens BancShares, Inc. | 16.39 | - | 4.73 | 1.62 | 0.30% | Stock Report of FCNCA |
| Ticker | Company | Sales past 5Y | Sales Q/Q | EPS Q/Q | EPS next 5Y | Perf Year |
| SALM | Salem Media Group, Inc. | 2.80% | 0.30% | -273.1% | 7.0% | -37.10% |
| CATO | The Cato Corporation | -2.10% | -53.20% | -69.0% | 10.0% | 62.50% |
| OMI | Owens & Minor, Inc. | 1.00% | -46.50% | -576.6% | 4.7% | -36.93% |
| CHS | Chico's FAS, Inc. | -2.40% | -5.90% | -25.9% | 15.0% | 5.83% |
| HBAN | Huntington Bancshares Incorporated | 12.20% | 14.80% | 30.4% | 14.7% | 24.08% |
| DTE | DTE Energy Company | 7.50% | 10.60% | 30.7% | 5.5% | 1.55% |
| MRK | Merck & Co., Inc. | -3.20% | 5.40% | -10.5% | 7.2% | 6.72% |
| SYBT | Stock Yards Bancorp, Inc. | 5.00% | 18.50% | 28.2% | 10.0% | 10.60% |
| AIG | American International Group, Inc. | -7.10% | -7.10% | -13.6% | 34.6% | -14.51% |
| JEF | Jefferies Financial Group Inc. | 6.70% | 11.60% | -82.5% | 18.0% | -0.56% |
| NEU | NewMarket Corporation | -0.10% | 9.50% | -14.4% | 7.7% | -6.21% |
| AIMC | Altra Industrial Motion Corp. | 3.70% | 6.20% | 23.7% | 15.1% | -16.61% |
| PFLT | PennantPark Floating Rate Capital Ltd. | 37.50% | 28.30% | -55.4% | - | -6.60% |
| FFIN | First Financial Bankshares, Inc. | 9.00% | 17.80% | 30.1% | 10.0% | 51.62% |
| APH | Amphenol Corporation | 10.30% | 18.90% | 36.4% | 10.1% | 16.46% |
| ALLE | Allegion plc | 3.50% | 12.40% | 8.3% | 12.2% | 10.79% |
| FCNCA | First Citizens BancShares, Inc. | 1.90% | 11.50% | -30.7% | - | 36.56% |
| Ticker | Company | ROA | ROE | ROI | Oper- Margin | Debt/ Equity |
| SALM | Salem Media Group, Inc. | 3.70% | 9.30% | 3.7% | 6.4% | 1.11 |
| CATO | The Cato Corporation | 3.20% | 4.90% | 4.9% | 2.5% | - |
| OMI | Owens & Minor, Inc. | -4.00% | -14.70% | 3.7% | -1.3% | 2.08 |
| CHS | Chico's FAS, Inc. | 8.10% | 13.60% | 12.8% | 5.3% | 0.10 |
| HBAN | Huntington Bancshares Incorporated | 1.30% | 13.20% | 13.0% | 78.1% | 0.95 |
| DTE | DTE Energy Company | 3.40% | 11.90% | 7.0% | 12.0% | 1.34 |
| MRK | Merck & Co., Inc. | 1.50% | 3.90% | 8.7% | 12.3% | 0.72 |
| SYBT | Stock Yards Bancorp, Inc. | 1.30% | 12.90% | 26.9% | 89.2% | - |
| AIG | American International Group, Inc. | -1.30% | -10.00% | 1.9% | 3.6% | 0.55 |
| JEF | Jefferies Financial Group Inc. | 1.40% | 6.50% | 2.8% | 6.2% | 2.01 |
| NEU | NewMarket Corporation | 10.20% | 29.00% | 20.2% | 13.1% | 1.38 |
| AIMC | Altra Industrial Motion Corp. | 5.80% | 13.40% | 7.7% | 9.6% | 0.63 |
| PFLT | PennantPark Floating Rate Capital Ltd. | 3.90% | 6.40% | 4.7% | 58.5% | 0.73 |
| FFIN | First Financial Bankshares, Inc. | 1.90% | 14.50% | 21.2% | 93.0% | - |
| APH | Amphenol Corporation | 7.50% | 18.40% | 15.1% | 20.5% | 0.91 |
| ALLE | Allegion plc | 11.10% | 66.00% | 22.4% | 19.5% | 2.89 |
| FCNCA | First Citizens BancShares, Inc. | 0.90% | 9.40% | 19.9% | 94.9% | 0.07 |