NASDAQ Large Capitalized Dividend Stocks With Cheap P/E Ratios Researched by Dividend Yield - Stock, Capital, Investment. Here is a current overview of the best yielding dividend stocks of NASDAQ listed companies with a market capitalization above USD 10 billion. 797 companies from the technology exchange NASDAQ pay dividends of which 42 are large capitalized. In order to restrict the selection, I screened only stocks with a current low P/E ratio of less than 15. Exactly 12 stocks remained of which two are recommended with a strong buy rating.
Here are my favorite stocks:
Intel Corporation (NASDAQ: INTC) has a market capitalization of $134.33 billion. The company employs 100,100 people, generates revenues of $53,999.00 million and has a net income of $12,942.00 million. The firm’s earnings before interest, taxes, depreciation and amortization (EBITDA) amounts to $23,541.00 million. Because of these figures, the EBITDA margin is 43.60 percent (operating margin 32.37 percent and the net profit margin finally 23.97 percent).
The total debt representing 10.31 percent of the company’s assets and the total debt in relation to the equity amounts to 15.97 percent. Due to the financial situation, a return on equity of 27.15 percent was realized. Twelve trailing months earnings per share reached a value of $2.40. Last fiscal year, the company paid $0.78 in form of dividends to shareholders.
Here are the price ratios of the company: The P/E ratio is 11.01, Price/Sales 2.42 and Price/Book ratio 2.84. Dividend Yield: 3.28 percent. The beta ratio is 1.09.
 |
| Long-Term Stock History Chart Of Intel Corporation (Click to enlarge) |
 |
| Long-Term Dividends History of Intel Corporation (INTC) (Click to enlarge) |
 |
| Long-Term Dividend Yield History of Intel Corporation (NASDAQ: INTC) (Click to enlarge) |
Microsoft Corporation (NASDAQ: MSFT) has a market capitalization of $249.29 billion. The company employs 90,000 people, generates revenues of $69,943.00 million and has a net income of $23,150.00 million. The firm’s earnings before interest, taxes, depreciation and amortization (EBITDA) amounts to $29,927.00 million. Because of these figures, the EBITDA margin is 42.79 percent (operating margin 38.83 percent and the net profit margin finally 33.10 percent).
The total debt representing 10.97 percent of the company’s assets and the total debt in relation to the equity amounts to 20.88 percent. Due to the financial situation, a return on equity of 44.84 percent was realized. Twelve trailing months earnings per share reached a value of $2.76. Last fiscal year, the company paid $0.64 in form of dividends to shareholders.
Here are the price ratios of the company: The P/E ratio is 10.75, Price/Sales 3.38 and Price/Book ratio 4.13. Dividend Yield: 2.84 percent. The beta ratio is 0.99.
 |
| Long-Term Stock History Chart Of Microsoft Corporation (Click to enlarge) |
 |
| Long-Term Dividends History of Microsoft Corporation (MSFT) (Click to enlarge) |
 |
| Long-Term Dividend Yield History of Microsoft Corporation (NASDAQ: MSFT) (Click to enlarge) |
CME Group (NASDAQ: CME) has a market capitalization of $15.93 billion. The company employs 2,570 people, generates revenues of $3,003.70 million and has a net income of $952.10 million. The firm’s earnings before interest, taxes, depreciation and amortization (EBITDA) amounts to $2,086.90 million. Because of these figures, the EBITDA margin is 69.48 percent (operating margin 60.89 percent and the net profit margin finally 31.70 percent).
The total debt representing 7.21 percent of the company’s assets and the total debt in relation to the equity amounts to 12.59 percent. Due to the financial situation, a return on equity of 4.83 percent was realized. Twelve trailing months earnings per share reached a value of $18.87. Last fiscal year, the company paid $4.60 in form of dividends to shareholders.
Here are the price ratios of the company: The P/E ratio is 12.71, Price/Sales 5.25 and Price/Book ratio 0.79. Dividend Yield: 2.36 percent. The beta ratio is 1.06.
 |
| Long-Term Stock History Chart Of CME Group Inc. (Click to enlarge) |
 |
| Long-Term Dividends History of CME Group Inc. (CME) (Click to enlarge) |
 |
| Long-Term Dividend Yield History of CME Group Inc. (NASDAQ: CME) (Click to enlarge) |
Teva Pharmaceutical Industries (NASDAQ: TEVA) has a market capitalization of $40.56 billion. The company employs 42,000 people, generates revenues of $16,121.00 million and has a net income of $3,363.00 million. The firm’s earnings before interest, taxes, depreciation and amortization (EBITDA) amounts to $4,744.00 million. Because of these figures, the EBITDA margin is 29.43 percent (operating margin 23.38 percent and the net profit margin finally 20.86 percent).
The total debt representing 18.04 percent of the company’s assets and the total debt in relation to the equity amounts to 31.35 percent. Due to the financial situation, a return on equity of 16.18 percent was realized. Twelve trailing months earnings per share reached a value of $3.36. Last fiscal year, the company paid $0.78 in form of dividends to shareholders.
Here are the price ratios of the company: The P/E ratio is 13.62, Price/Sales 2.65 and Price/Book ratio 1.87. Dividend Yield: 1.89 percent. The beta ratio is 0.31.
 |
| Long-Term Stock History Chart Of Teva Pharmaceutical In... (Click to enlarge) |
 |
| Long-Term Dividends History of Teva Pharmaceutical In... (TEVA) (Click to enlarge) |
 |
| Long-Term Dividend Yield History of Teva Pharmaceutical In... (NASDAQ: TEVA) (Click to enlarge) |
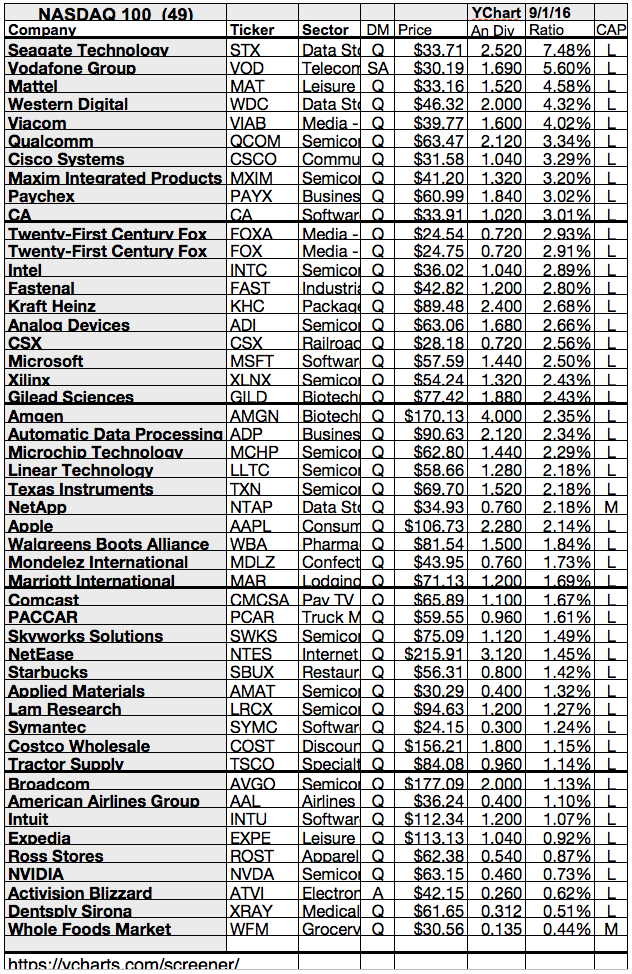
Here is the full table with some fundamentals (TTM):
 |
| 12 Best Yielding NASDAQ Large Cap Dividend Stocks (Click to enlarge) |
Take a closer look at the full table. The average price to earnings ratio (P/E ratio) amounts to 11.90 while the forward price to earnings ratio is 11.09. The dividend yield has a value of 2.08 percent. Price to book ratio is 2.40 and price to sales ratio 2.51. The operating margin amounts to 29.10 percent.
Related stock ticker symbols:
VOD, INTC, MSFT, AMAT, SPLS, FITB, CME, VIAB, TXN, TEVA, ASML, CA
Selected Articles:
* I have no positions in any stocks mentioned, and no plans to initiate any positions within the next 72 hours. I receive no compensation to write about any specific stock, sector or theme.


