
Dividend Income orientated Blog. Ideas and Thoughts about Stocks, Dividends and Growth Opportunities.
Showing posts with label FINL. Show all posts
Showing posts with label FINL. Show all posts


My Favorite Dividend Contenders For March 2017
With a new month close at hand, it is time, once again, for me to lay out some of my stock considerations for the next several weeks of March.
The point of these posts is to help take some of the guesswork out of where I plan to allocate my fresh capital going forward. By making my selections ahead of time, I find it easier to commit to buys, as all the homework and investment theses have already been completed on my end.
All that's left to do is pull the "buy" trigger. These days, it seems easier said than done as the market - and many stocks I am considering - continue to march higher. I am finding it increasingly difficult to decide where I'd like to allocate my fresh capital.
Rest assured, I will be making at least one buy in March, as I aim to stick to my own mantra of remaining consistent with my buys during all market conditions.
I have no intentions of breaking my streak of making monthly buys. That being said, as I look at my portfolio, I am left with a handful of potential choices for the month of March.
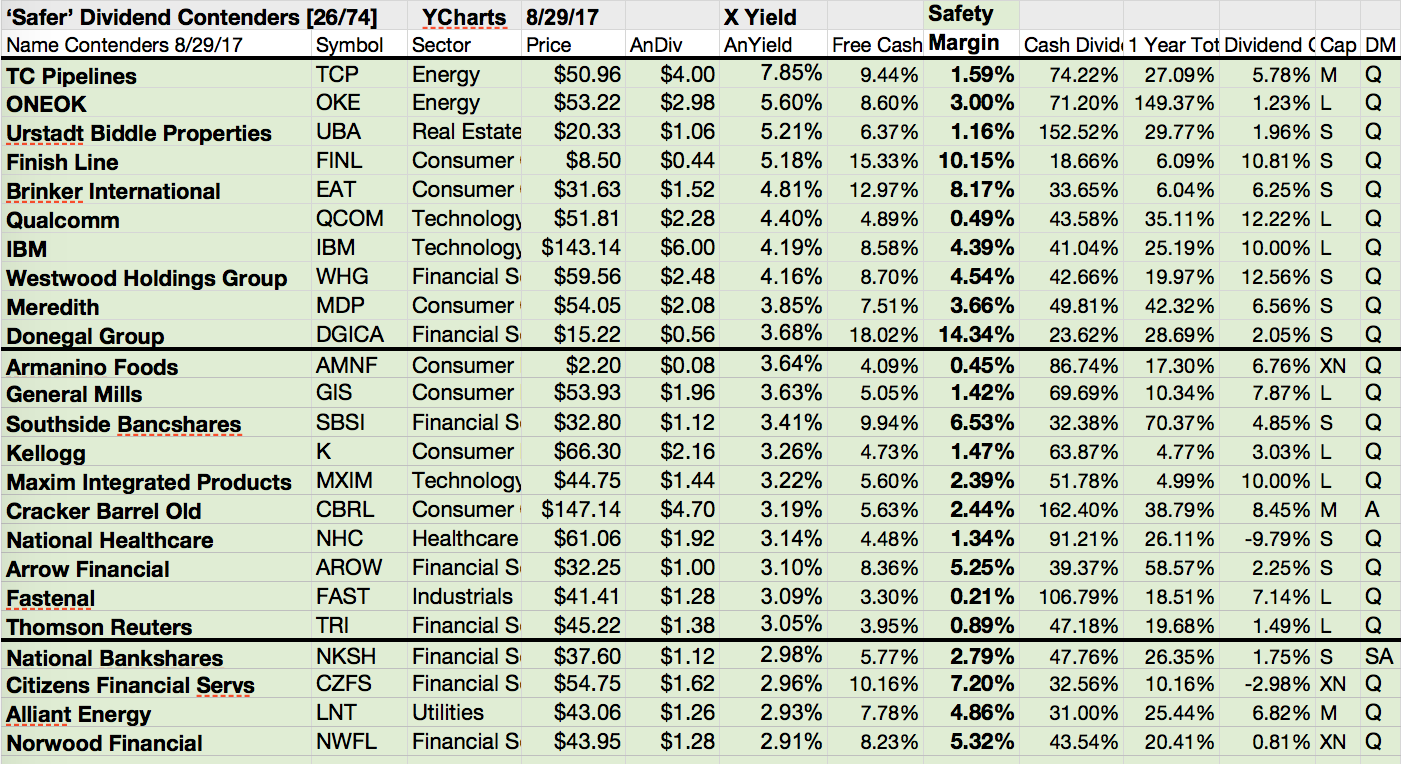
Here are my favorite Dividend Contenders...
The point of these posts is to help take some of the guesswork out of where I plan to allocate my fresh capital going forward. By making my selections ahead of time, I find it easier to commit to buys, as all the homework and investment theses have already been completed on my end.
All that's left to do is pull the "buy" trigger. These days, it seems easier said than done as the market - and many stocks I am considering - continue to march higher. I am finding it increasingly difficult to decide where I'd like to allocate my fresh capital.
Rest assured, I will be making at least one buy in March, as I aim to stick to my own mantra of remaining consistent with my buys during all market conditions.
I have no intentions of breaking my streak of making monthly buys. That being said, as I look at my portfolio, I am left with a handful of potential choices for the month of March.
Here are my favorite Dividend Contenders...
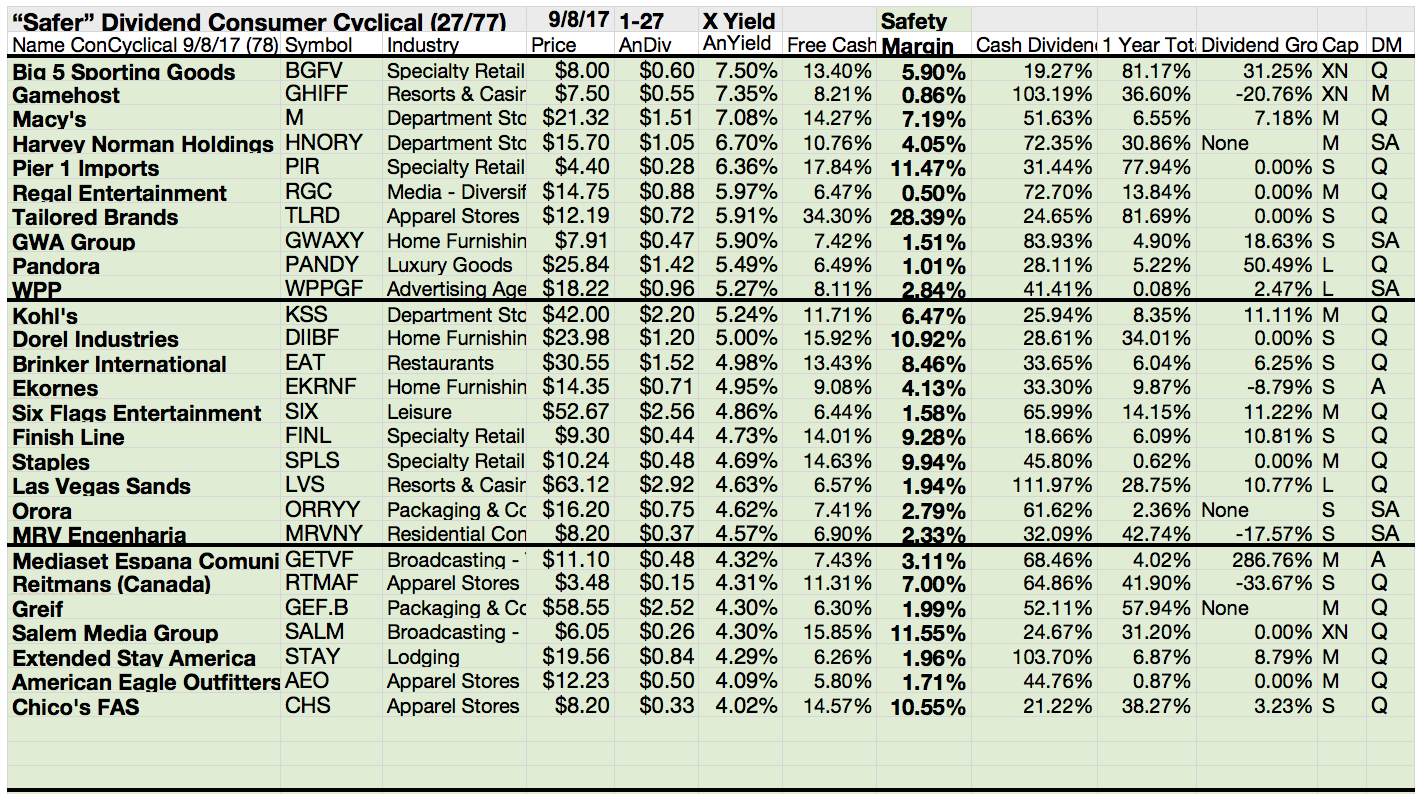
16 Long-Term Dividend Growers At Reasonable Prices
A very, very famous investor once said that he liked to buy excellent businesses at 'reasonable prices.' I like to think that I am of the same mindset. A strategy of mine is to look for such businesses with real competitive advantages, but ones that are dividend payers and dividend growers.
My watch list now includes a couple hundred stocks, all of which are dividend payers. Today I'd like to share a small list of those which I believe retail income investors can buy 'off the shelf' right now.
These are the results...
My watch list now includes a couple hundred stocks, all of which are dividend payers. Today I'd like to share a small list of those which I believe retail income investors can buy 'off the shelf' right now.
These are the results...

The Best Dividend Ideas From The Buyback Achievers Index

Although stock price appreciation and dividends are the two most common ways of doing this, there are other useful, and often overlooked, ways for companies to share their wealth with investors: Dividends and share buybacks.
Buybacks is one way to build values for investors. It's a kind of income usage. Buying back own shares increases future eps when the net income is constant.
Today I would like to introduce a number of stocks with interesting fundamentals and price ratios that have bought own shares in a significant amount back.
Each of the attached stocks have fulfilled all of the following criteria:
- Share reduction over the past year over 5%
- Forward P/E under 15
- Debt-to-equity under 1
- Positive ROA
- EPS growth for the next five years over 5%
- Dividend yield at least 2%
Here are the results...
11 Dividend Challengers With Highest Dividend Payout Potential
Dividend Challengers With Significant Payout Potential Researched By Dividend Yield - Stock, Capital, Investment. Dividend Challengers are
stocks with a history of consecutive dividend hikes of more than 5 years but
less than 10. Exactly 195
companies raised dividends over such a long history but the potential for
additional increases is still high. I made a screen of the best yielding
Dividend Challengers with the highest dividend payout potential. First, I
selected all stocks with a debt to equity ratio of less than 0.5 and a current
payout ratio below 20 percent. Second, the company needs to grow in earnings
over the mid-term. Because of this, I decided to screen all stocks with 5-year
earnings per share growth of at least 10 percent. Eleven companies remained of
which nine are currently recommended to buy.
20 Dividend Challengers With Very Low Debt
Dividend Challengers With Low Debt To Equity Ratios Researched By Dividend Yield - Stock, Capital, Investment. Stocks with a history of
rising dividends of more than 5 years but less than 9 years in a row are
named Dividend Challengers. 189 companies with such a dividend growth
performance are available at the markets. But past dividend growth does not
guarantee a future dividend hike if earnings are down. A major ratio to judge
the ability of paying dividends from capital assets is the debt to equity
ratio.
I screened all Dividend Challengers by companies with very low debt to
equity ratios (ratio below 0.1). Those stocks are nearly free of debt and have
a generous cushion of future dividend hikes. Below the results are some of
stocks with a very low market capitalization which are not to recommend in a
deeper analysis. 20 stocks with a market capitalization of more than USD 300 million remained. Twelve of them have a current buy or better rating.
Stocks With Fastest Dividend Growth January 2012
Shares With Highest Dividend Growth by Dividend Yield – Stock, Capital, Investment. Here is a current sheet of companies with fastest dividend growth compared to the previous dividend declaration. The dividend growth is often a good indicator for the financial health of a stock. Companies with a strong increase in dividends judge the future of their company rosy. They give money back to shareholders that they don’t need for their business. In total, 40 stocks increased dividends of which 14 raised dividends by more than 10 percent.
The biggest dividend hike was realized by Marcy (M) and DDR Corporation (DDR). M doubled dividends and DDR raised distributions by 50 percent. The average dividend yield of all growth stocks amounts to 3.79 percent and the dividend growth is 11.35.
Here are my favorites with fast dividend growth:
AmeriGas Partners (NYSE: APU) has a market capitalization of $2.42 billion. The company employs 5,460 people, generates revenues of $2,537.96 million and has a net income of $140.92 million. The firm’s earnings before interest, taxes, depreciation and amortization (EBITDA) amounts to $284.43 million. Because of these figures, the EBITDA margin is 11.21 percent (operating margin 8.07 percent and the net profit margin finally 5.55 percent).
The total debt representing 57.30 percent of the company’s assets and the total debt in relation to the equity amounts to 303.85 percent. Due to the financial situation, a return on equity of 36.92 percent was realized. Twelve trailing months earnings per share reached a value of $2.30. Last fiscal year, the company paid $2.89 in form of dividends to shareholders.
Here are the price ratios of the company: The P/E ratio is 18.40, Price/Sales 0.94 and Price/Book ratio 7.12. Dividend Yield: 7.08 percent. The beta ratio is 0.40.
 |
| Long-Term Stock History Chart Of AmeriGas Partners, L.P. (Click to enlarge) |
 |
| Long-Term Dividends History of AmeriGas Partners, L.P. (APU) (Click to enlarge) |
 |
| Long-Term Dividend Yield History of AmeriGas Partners, L.P. (NYSE: APU) (Click to enlarge) |
Alliant Energy (NYSE: LNT) has a market capitalization of $4.73 billion. The company employs 4,704 people, generates revenues of $3,416.10 million and has a net income of $308.00 million. The firm’s earnings before interest, taxes, depreciation and amortization (EBITDA) amounts to $848.40 million. Because of these figures, the EBITDA margin is 24.84 percent (operating margin 16.28 percent and the net profit margin finally 9.02 percent).
The total debt representing 29.65 percent of the company’s assets and the total debt in relation to the equity amounts to 87.72 percent. Due to the financial situation, a return on equity of 10.21 percent was realized. Twelve trailing months earnings per share reached a value of $2.64. Last fiscal year, the company paid $1.58 in form of dividends to shareholders.
Here are the price ratios of the company: The P/E ratio is 16.13, Price/Sales 1.40 and Price/Book ratio 1.66. Dividend Yield: 4.16 percent. The beta ratio is 0.52.
 |
| Long-Term Stock History Chart Of Alliant Energy Corpora... (Click to enlarge) |
 |
| Long-Term Dividends History of Alliant Energy Corpora... (LNT) (Click to enlarge) |
 |
| Long-Term Dividend Yield History of Alliant Energy Corpora... (NYSE: LNT) (Click to enlarge) |
Pentair (NYSE: PNR) has a market capitalization of $3.71 billion. The company employs 14,300 people, generates revenues of $3,030.77 million and has a net income of $202.95 million. The firm’s earnings before interest, taxes, depreciation and amortization (EBITDA) amounts to $416.65 million. Because of these figures, the EBITDA margin is 13.75 percent (operating margin 11.03 percent and the net profit margin finally 6.70 percent).
The total debt representing 17.80 percent of the company’s assets and the total debt in relation to the equity amounts to 33.80 percent. Due to the financial situation, a return on equity of 9.67 percent was realized. Twelve trailing months earnings per share reached a value of $2.17. Last fiscal year, the company paid $0.76 in form of dividends to shareholders.
Here are the price ratios of the company: The P/E ratio is 17.31, Price/Sales 1.21 and Price/Book ratio 1.75. Dividend Yield: 2.37 percent. The beta ratio is 1.07.
 |
| Long-Term Stock History Chart Of Pentair, Inc. (Click to enlarge) |
 |
| Long-Term Dividends History of Pentair, Inc. (PNR) (Click to enlarge) |
 |
| Long-Term Dividend Yield History of Pentair, Inc. (NYSE: PNR) (Click to enlarge) |
Macy's (NYSE: M) has a market capitalization of $15.04 billion. The company employs 166,000 people, generates revenues of $25,003.00 million and has a net income of $847.00 million. The firm’s earnings before interest, taxes, depreciation and amortization (EBITDA) amounts to $3,085.00 million. Because of these figures, the EBITDA margin is 12.34 percent (operating margin 7.58 percent and the net profit margin finally 3.39 percent).
The total debt representing 35.99 percent of the company’s assets and the total debt in relation to the equity amounts to 134.27 percent. Due to the financial situation, a return on equity of 16.64 percent was realized. Twelve trailing months earnings per share reached a value of $2.71. Last fiscal year, the company paid $0.20 in form of dividends to shareholders.
Here are the price ratios of the company: The P/E ratio is 13.21, Price/Sales 0.59 and Price/Book ratio 2.71. Dividend Yield: 2.26 percent. The beta ratio is 1.63.
 |
| Long-Term Stock History Chart Of Macy's, Inc. (Click to enlarge) |
 |
| Long-Term Dividends History of Macy's, Inc. (M) (Click to enlarge) |
 |
| Long-Term Dividend Yield History of Macy's, Inc. (NYSE: M) (Click to enlarge) |
The McGraw-Hill (NYSE: MHP) has a market capitalization of $13.61 billion. The company employs 20,755 people, generates revenues of $6,168.33 million and has a net income of $851.87 million. The firm’s earnings before interest, taxes, depreciation and amortization (EBITDA) amounts to $1,817.47 million. Because of these figures, the EBITDA margin is 29.46 percent (operating margin 23.04 percent and the net profit margin finally 13.81 percent).
The total debt representing 17.00 percent of the company’s assets and the total debt in relation to the equity amounts to 54.20 percent. Due to the financial situation, a return on equity of 40.82 percent was realized. Twelve trailing months earnings per share reached a value of $2.78. Last fiscal year, the company paid $0.94 in form of dividends to shareholders.
Here are the price ratios of the company: The P/E ratio is 16.71, Price/Sales 2.19 and Price/Book ratio 6.41. Dividend Yield: 2.17 percent. The beta ratio is 1.07.
 |
| Long-Term Stock History Chart Of The McGraw-Hill Compan... (Click to enlarge) |
 |
| Long-Term Dividends History of The McGraw-Hill Compan... (MHP) (Click to enlarge) |
 |
| Long-Term Dividend Yield History of The McGraw-Hill Compan... (NYSE: MHP) (Click to enlarge) |
Here is the full table of dividend growth stocks from last month:
 |
| Stocks With Fastest Dividend Growth January 2012 (Click to enlarge) |
Related Stock Ticker:
M, DDR, MOFG, ALX, FINL, HCII, FDO, PFBX, RBN, GCE, TUC, SLB, OZRK, PNR, GJO, TRGP, OKE, WSO, LNT, ISM, OSM, EBTC, KALU, LLTC, WMB, GJP, GJJ, GJK, XTEX, APU, PAA, GEL, GJR, OKS, OHI, CMLP, MHP, VNR, TLP, EPD
Selected Articles:
Subscribe to:
Posts (Atom)